
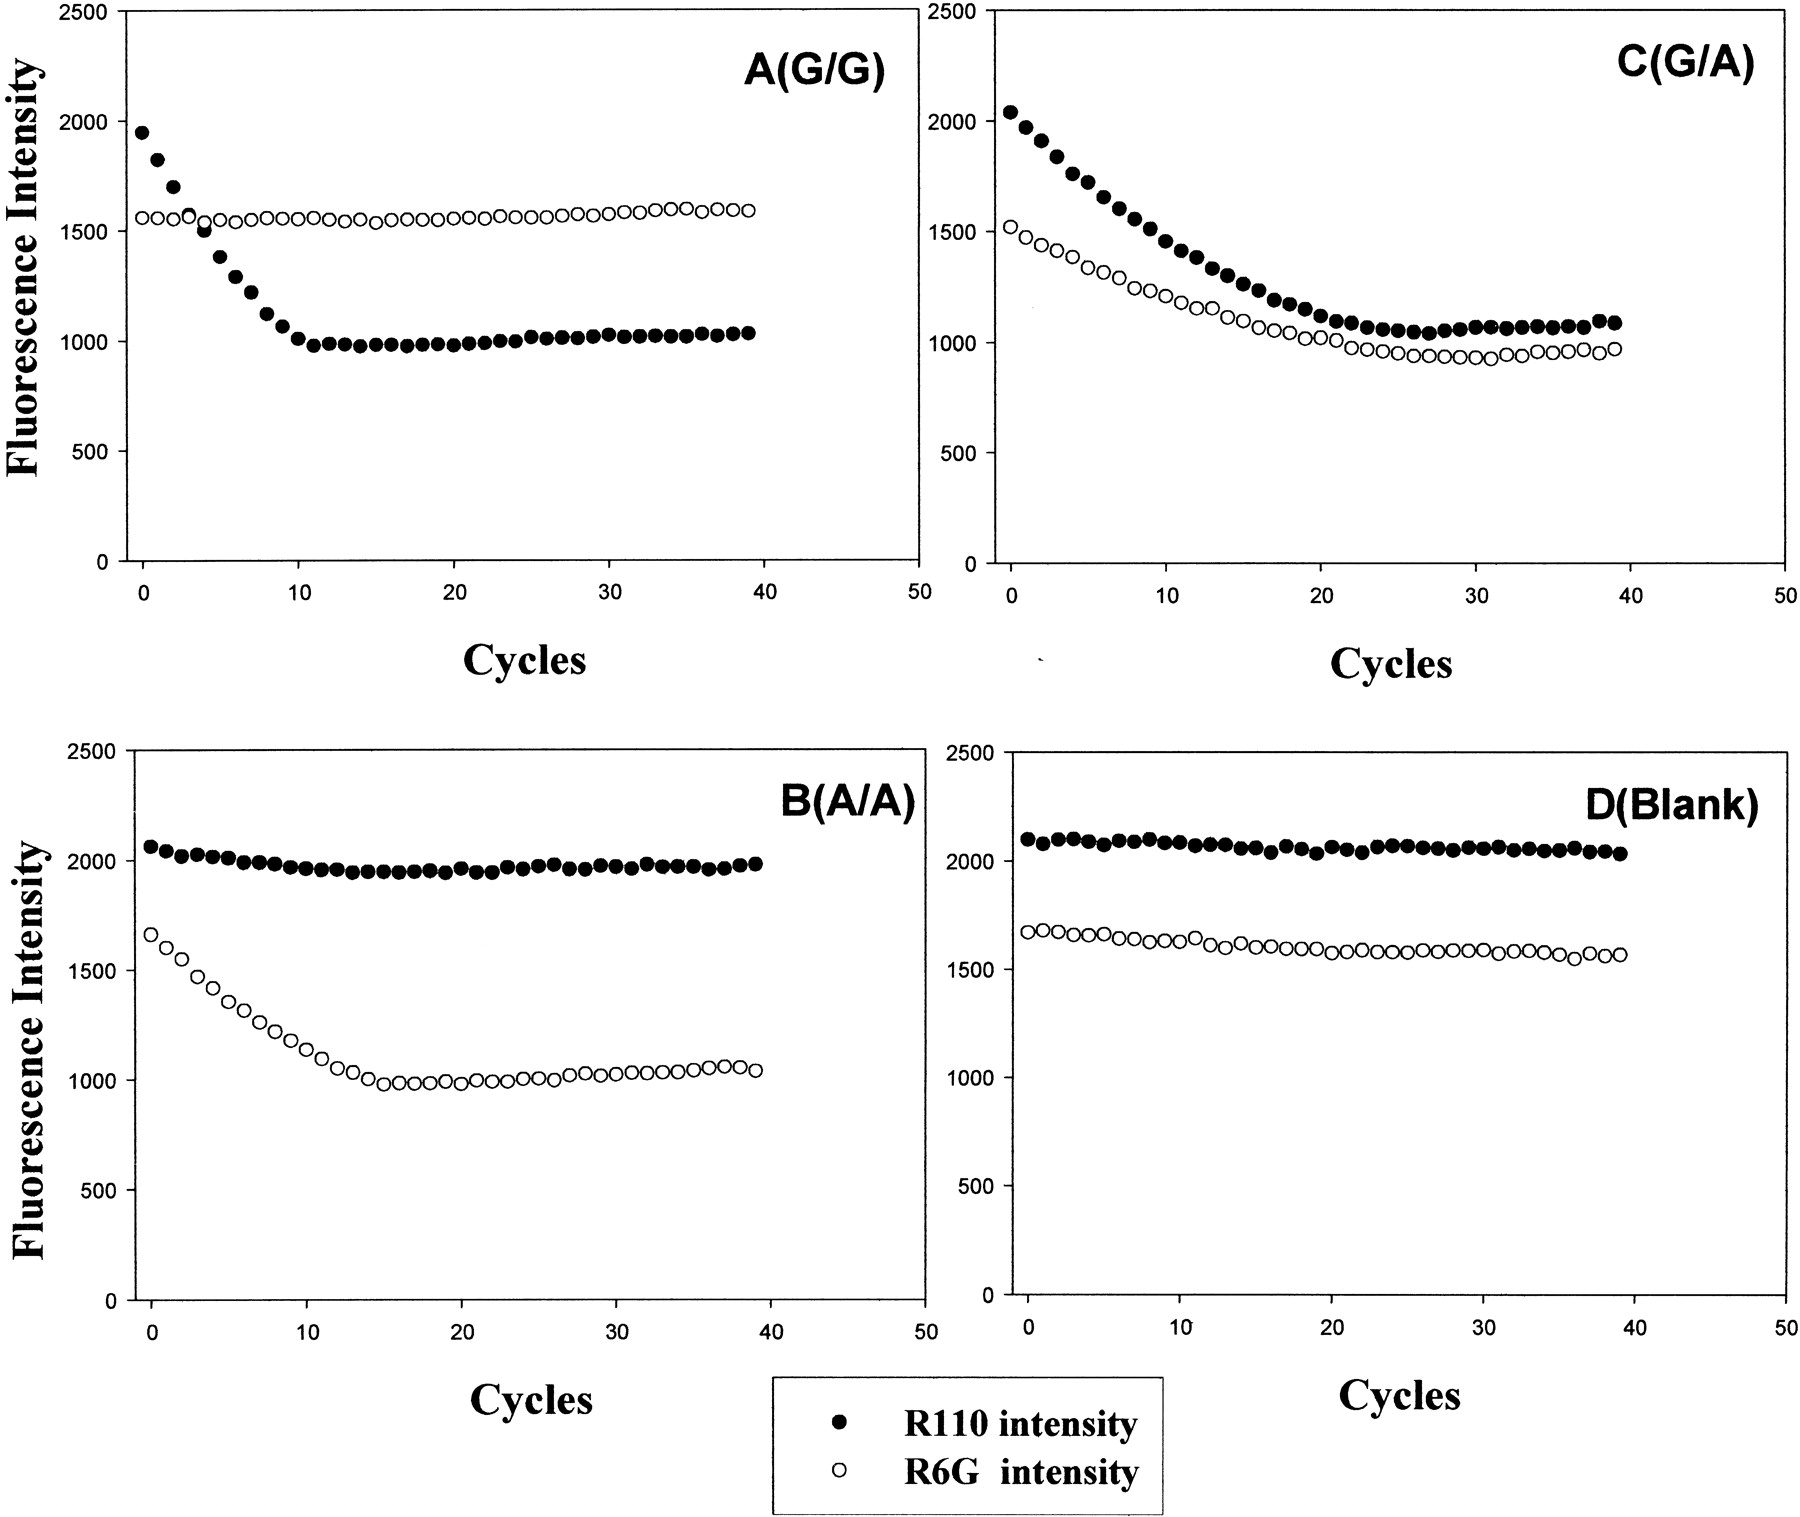
Figure 2.
The real-time fluorescence intensity profiles of four representative samples tested for SNP marker rs154162 during thermal cycling of the primer extension step of the TDI assay. The fluorescence readings were at the emission maxima for R110-G and R6G-A acycloterminators using multicomponent analysis to subtract contributions of fluorescence from the other dye at those wavelengths based on the pure spectra of R110 and R6G. (●) R110 fluorescence; (○) R6G fluorescence. The intensity profiles of (A) a G/G homozygous sample, (B) an A/A homozygous sample, (C) a G/A heterozygous sample, and (D) negative control.


