
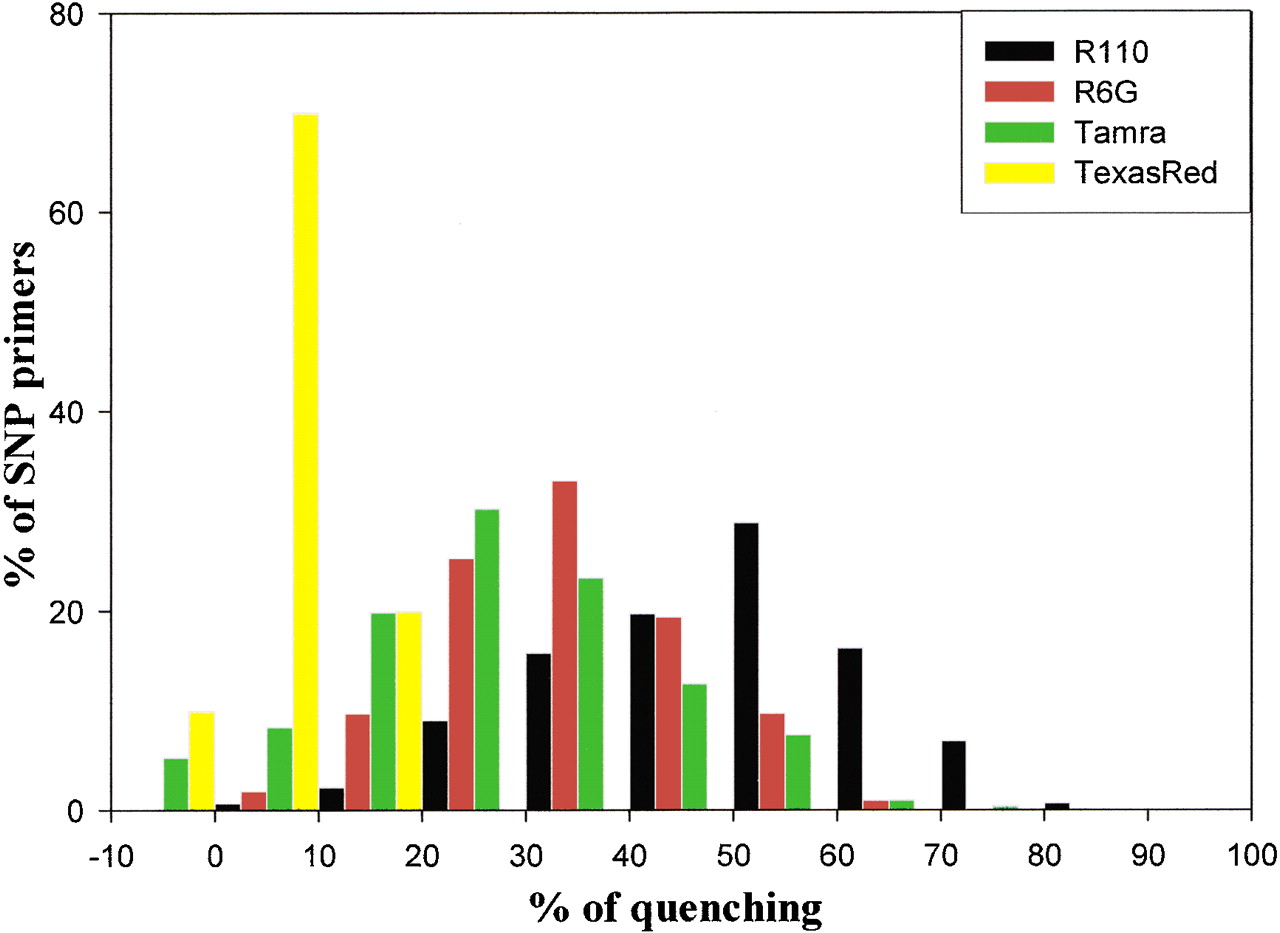
Figure 1.
The quenching patterns for four dye-labeled acycloterminators, R110, R6G, Tamra, and Texas Red. The quenching pattern for R110-acycloterminators (black bars) was derived from results of over 667 SNP primers. Red, green, and yellow bars represent the quenching patterns of R6G (258 SNP primers), Tamra (667 SNP primers), and Texas Red (50 SNP primers) acycloterminators, respectively. Thex-axis is the percentage of quenching, which are grouped in 10% intervals from − 10%–0% to 90%–100%. The y-axis is the percentage of SNP primers in each of the quenching fractions.


