
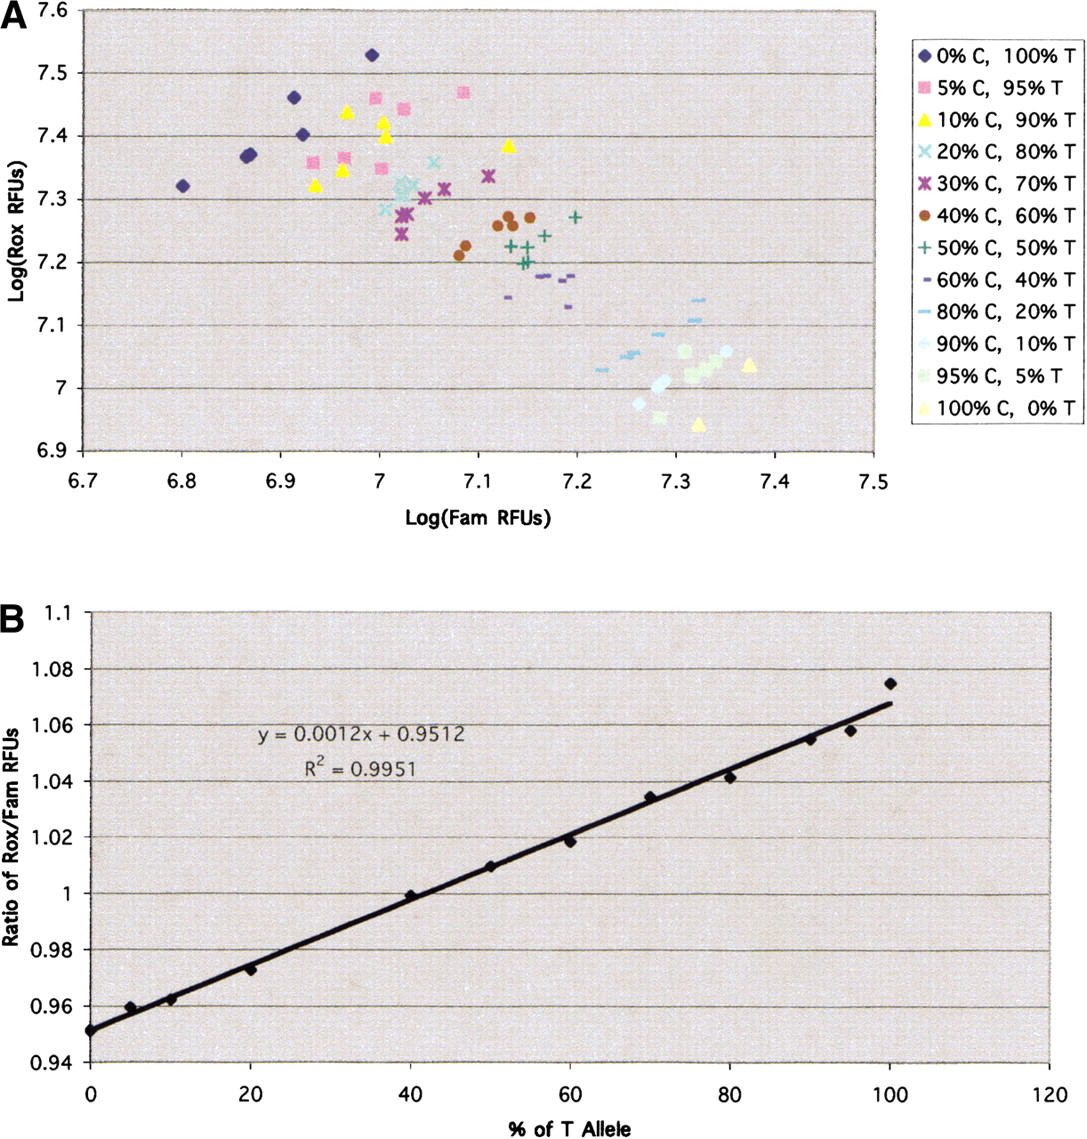
Figure 5.
Standards for allele frequency determination. (A) Fluorescence intensity measurements obtained from samples containing known proportions of two alleles (in this case, C and T). Each sample group has N = 6 except 100% C, for which N = 2. (B) Plot of the ratios of Fam and Rox fluorescence intensity measurements against the percentage of T allele in the sample. Linear regression analysis reveals a linear relationship.


