
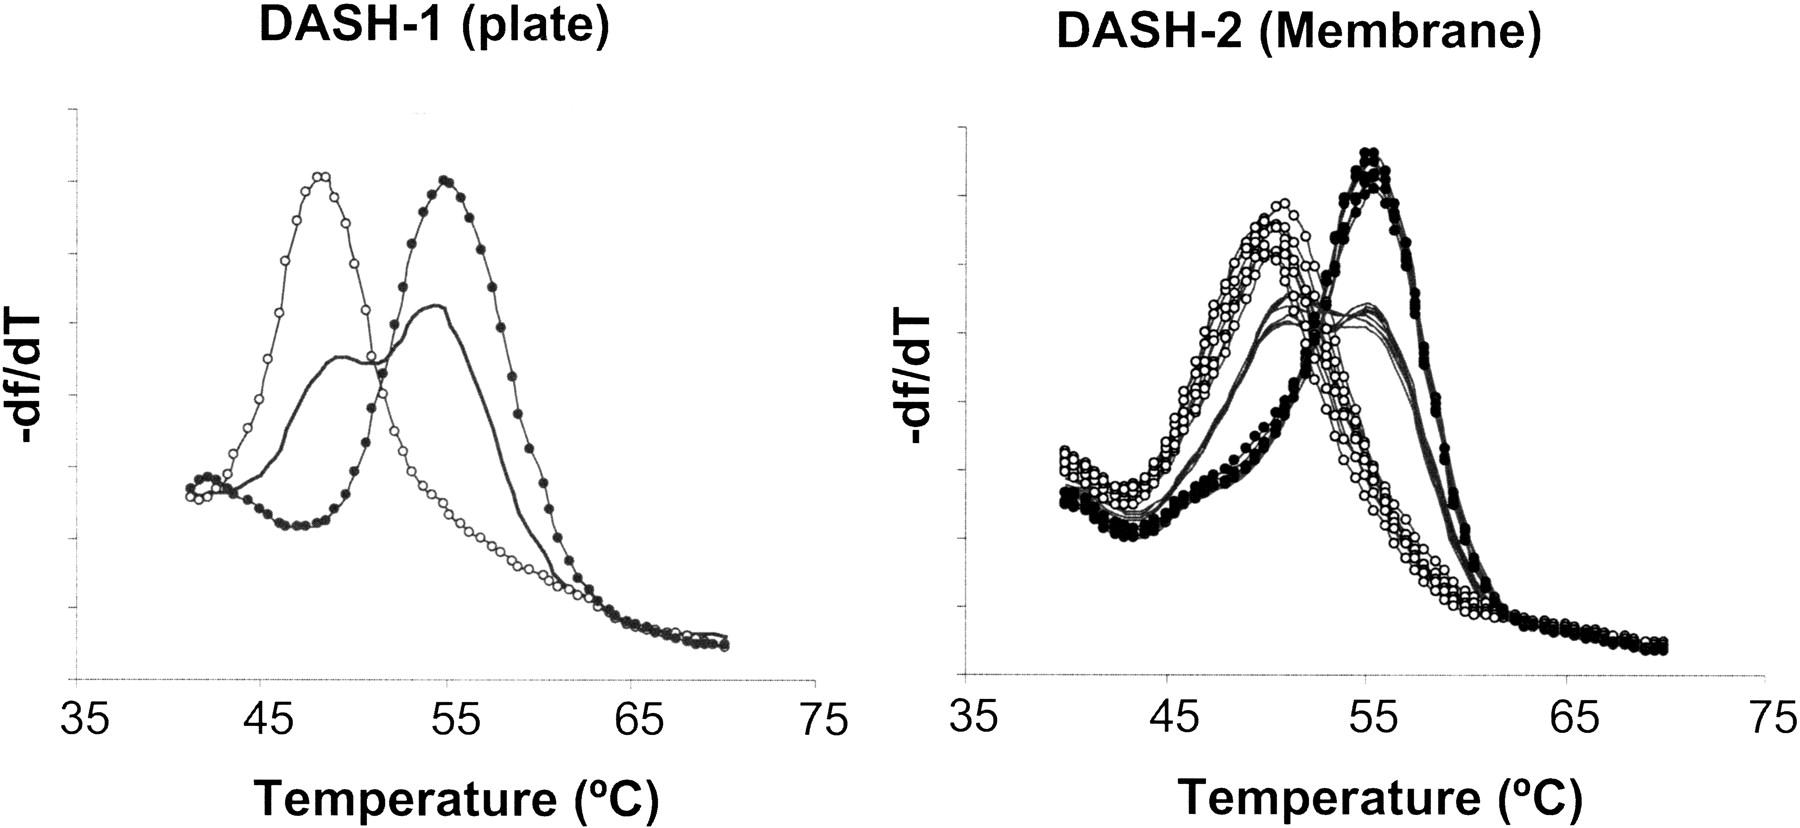
Figure 3.
DASH-2 melting curves are shown for all possible genotypes for marker SNP000008200[A/T]. Eight replicates of each genotype generated by the DASH-2 system (right) are compared to results produced by the first-generation DASH platform (left). The df/dT scale is arbitrary and platform dependent.


