
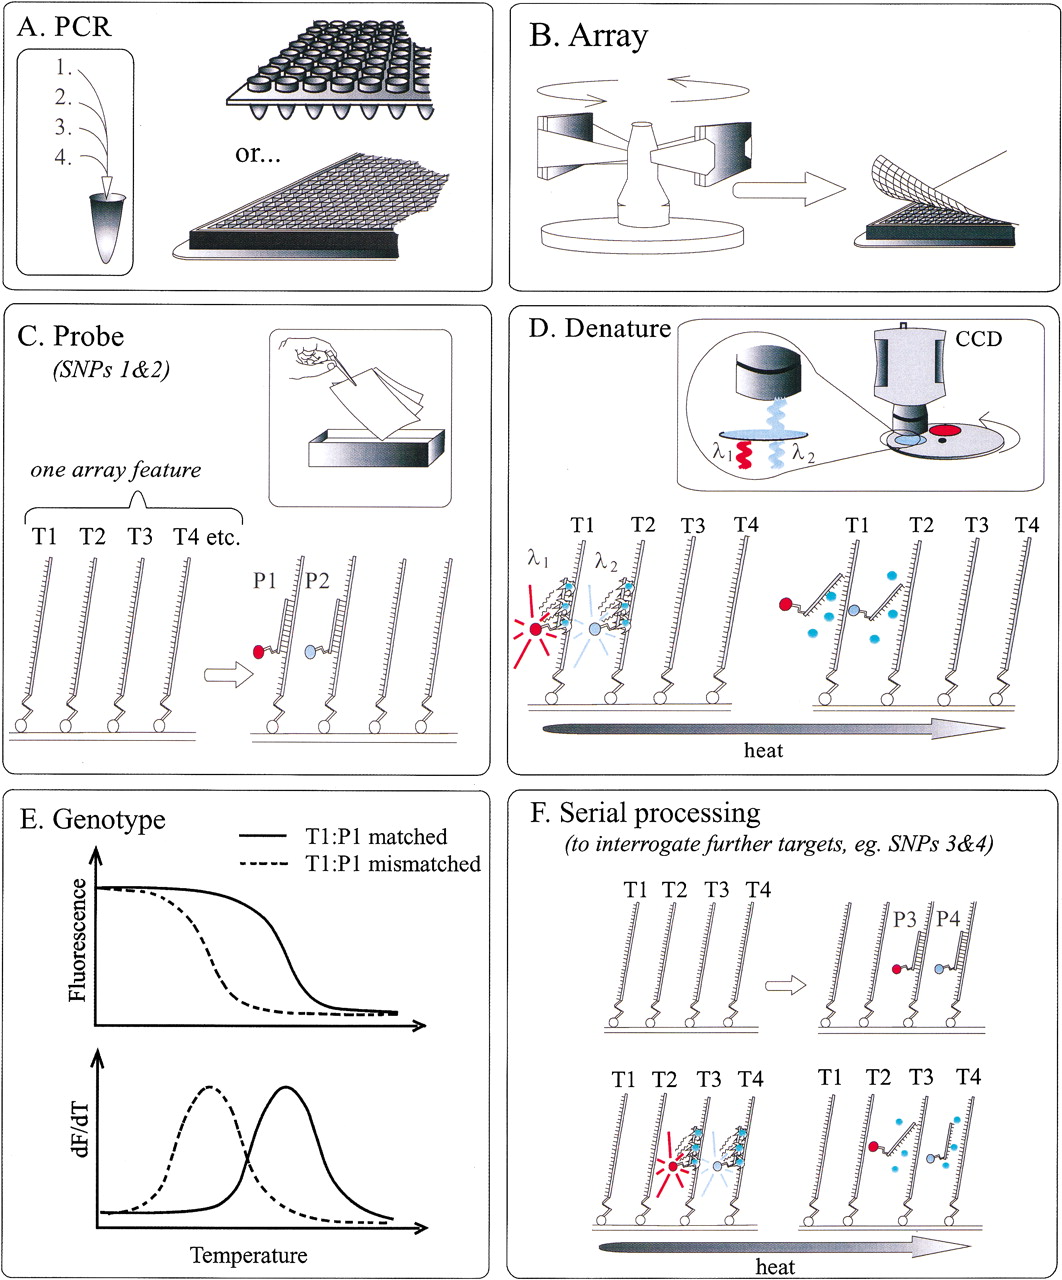
DASH-2 schematic. DASH-2 examines products from optionally multiplexed, small-volume PCRs, performed in any density or format of plate (A). PCR products are transferred to membranes to create “macro-arrays” by specific capture of one strand on the membrane surface. In the absence of robotics, this is conveniently achieved by centrifugation (B). Using robotics (not illustrated), would allow staggered subarraying of many different plates onto a single membrane to achieve ultrahigh-throughput. Alkali rinsing (to remove PCR reagents and make targets single stranded) and saturation hybridization with allele-specific probe(s) entails immersion in buffer trays or enlisting special washing platforms, and more than one target per array feature may be interrogated in parallel by using differentially labeled (“spectrally multiplexed”) probes (C). Alternatively, probe cocktails could be employed to extract different assay (SNP) results from different features (not illustrated). Fluorescence signals are generated by means of iFRET (Howell et al. 2002). This entails using an allele-specific probe that is end-labeled with an acceptor-fluorophore, plus double-strand specific fluorescence dye to act as fluorescence donor (D). Dynamic tracking of probe-target denaturation is achieved by heating the membrane array in a controlled manner while monitoring fluorescence signal changes via a CCD camera (D). If using a spectrally multiplexed set of iFRET probes, the target-specific signals are separately visualized by imaging the array through appropriate optical filters on a rotating wheel (D). As Tm s specific for different probe-target combinations are reached, the iFRET signals rapidly disappear. These transitions are plotted as the negative derivative of fluorescence versus temperature (E), and thereby the target DNA alleles are revealed as peaks at high (probe matched) and low (probe mismatched) temperatures. Heterozygous targets show two peaks of melting behavior. Serial processing of the membrane is also possible, and thus additional sets of data may be extracted from array features by rerunning the DASH-2 procedure from the alkali rinse onwards, using extra sets of iFRET probes (F). Abbreviations: T1–4, target PCR products for different SNPs; P1–4, probes specific for single alleles of targets T1–4; lines marked as λ1 and λ2, distinct iFRET emission wavelengths from different fluorophores on probes (red and blue respectively); green circles indicate SYBR Green I dye molecules that transfer energy (star shapes) to the probe fluorophores, as per iFRET chemistry, only when the probe is bound to the target.


