
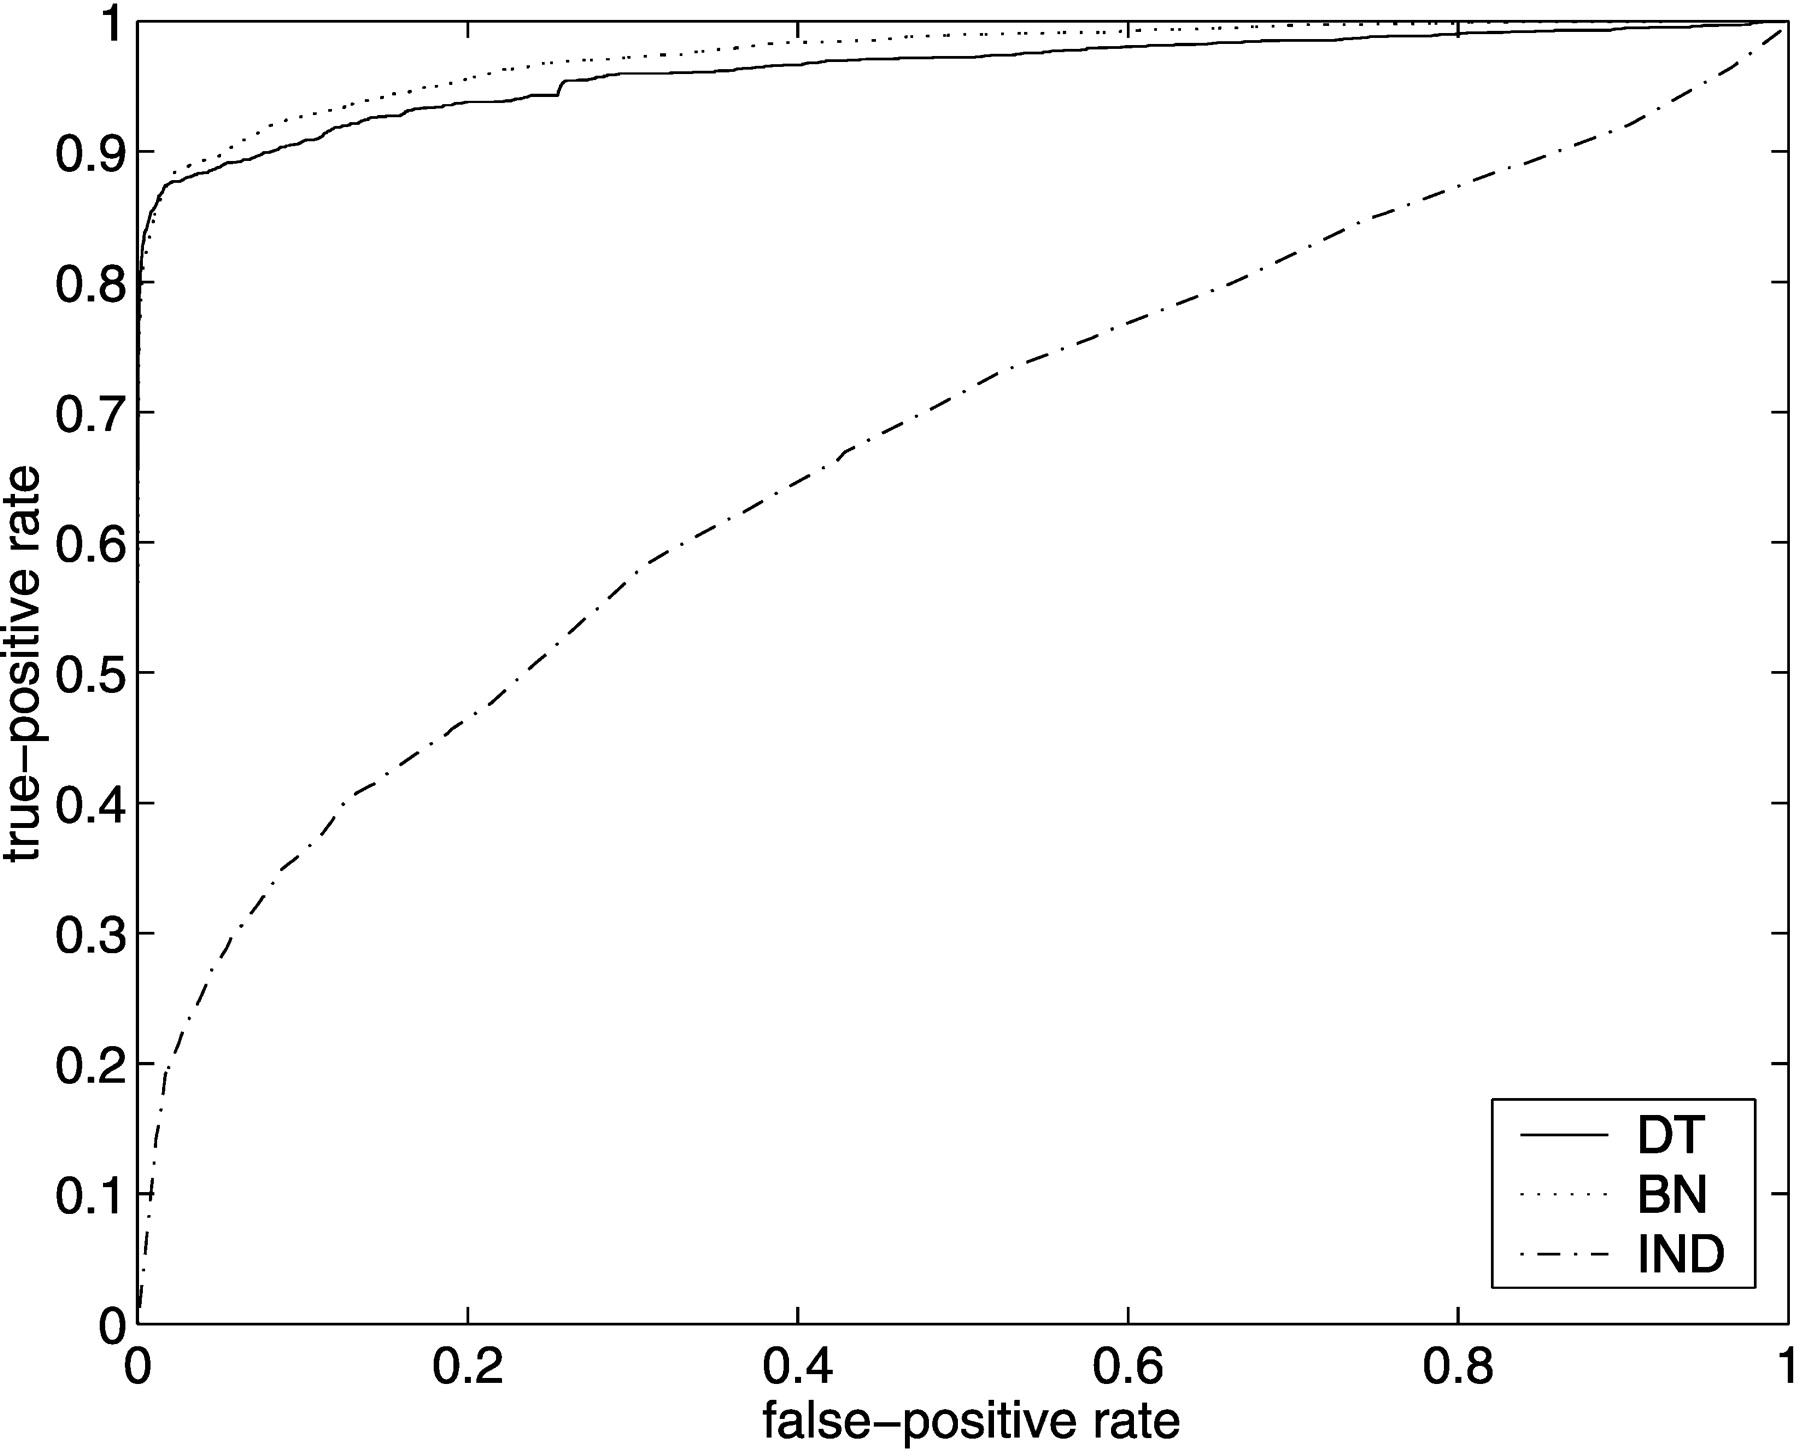
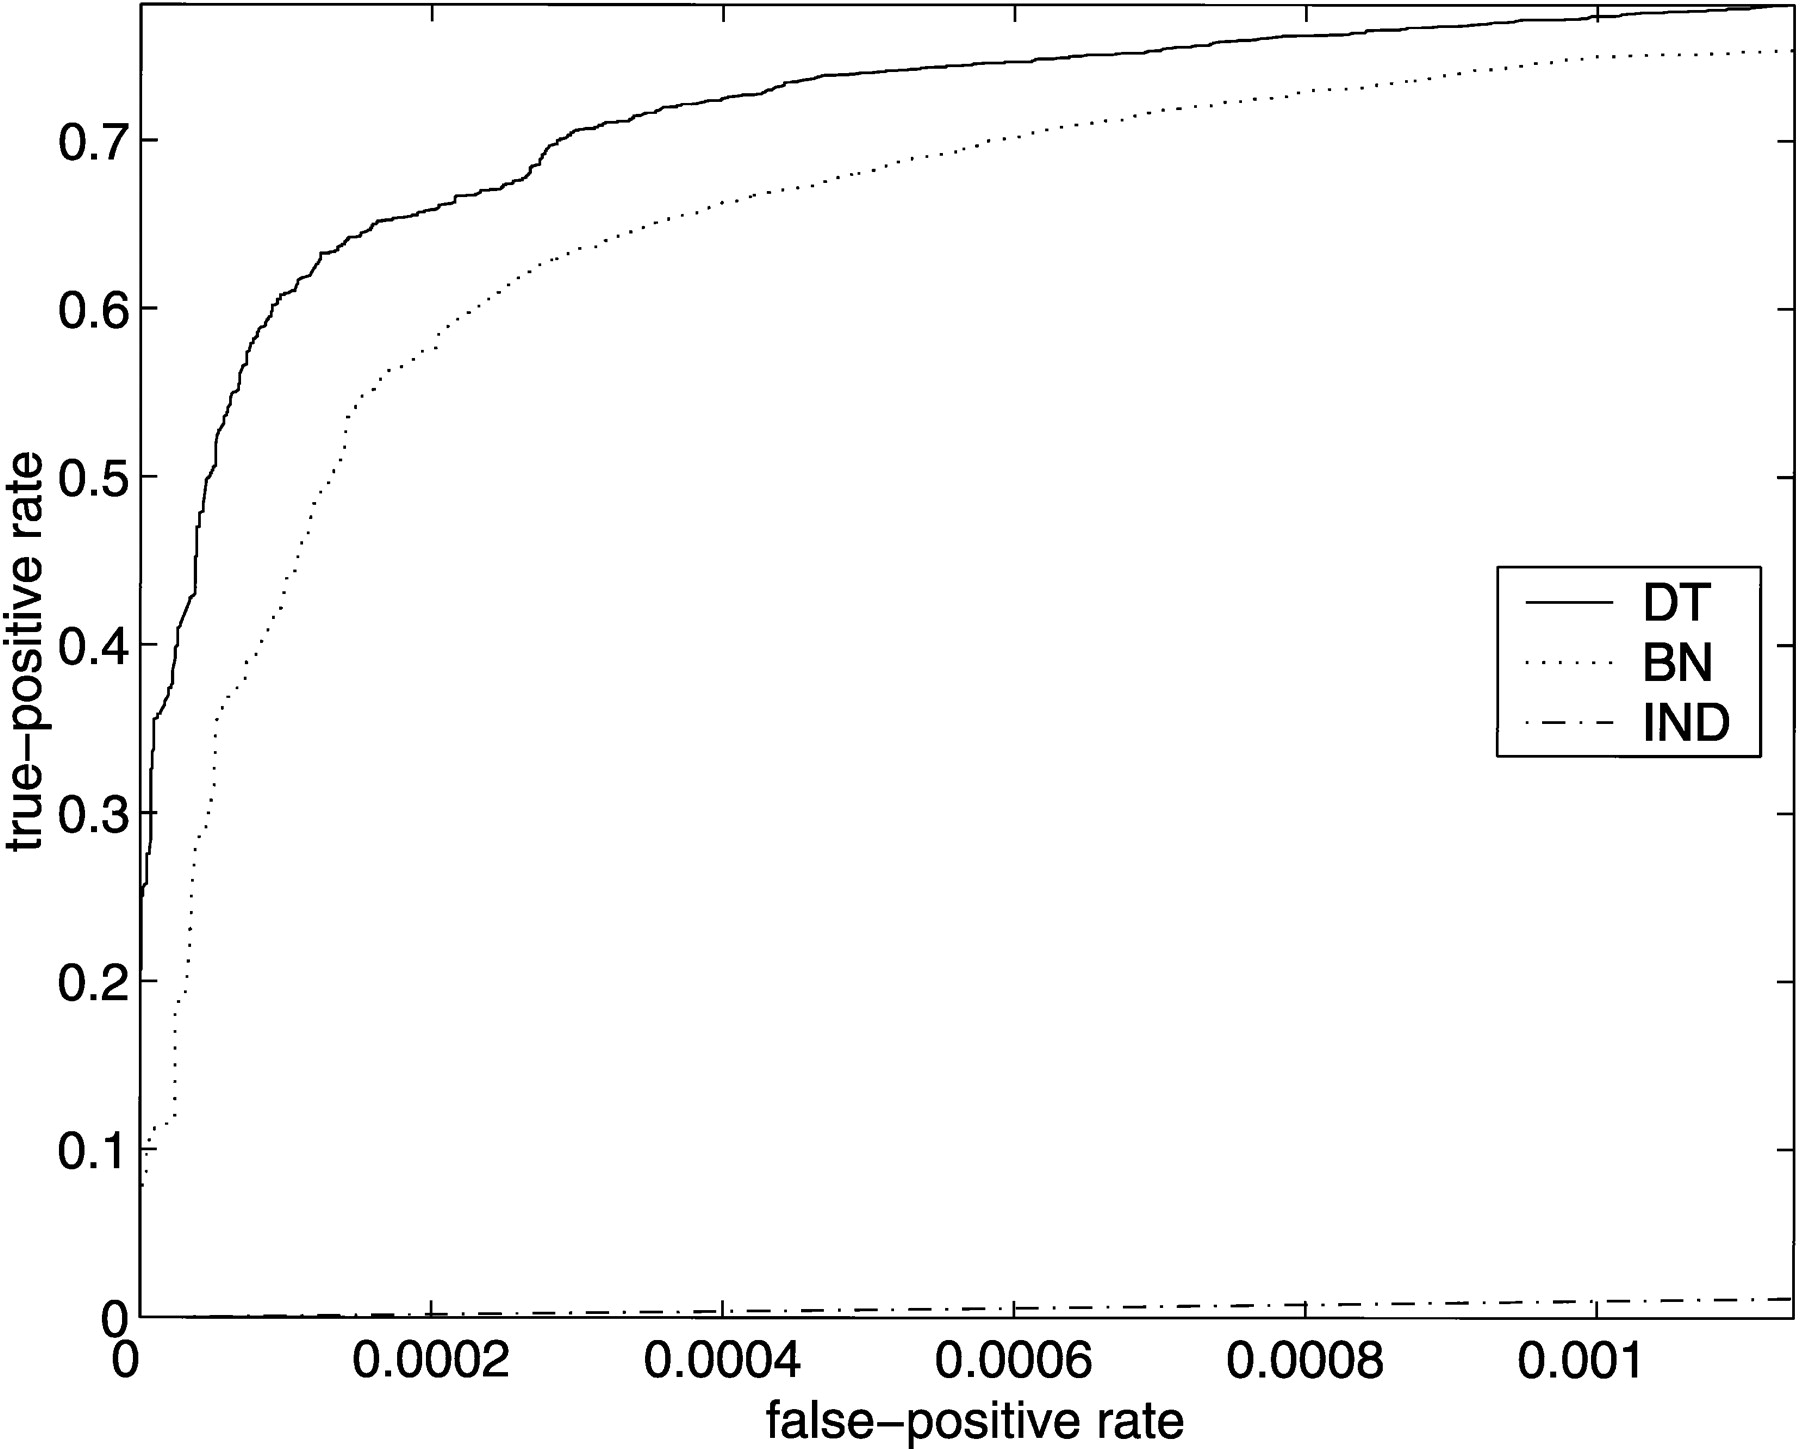
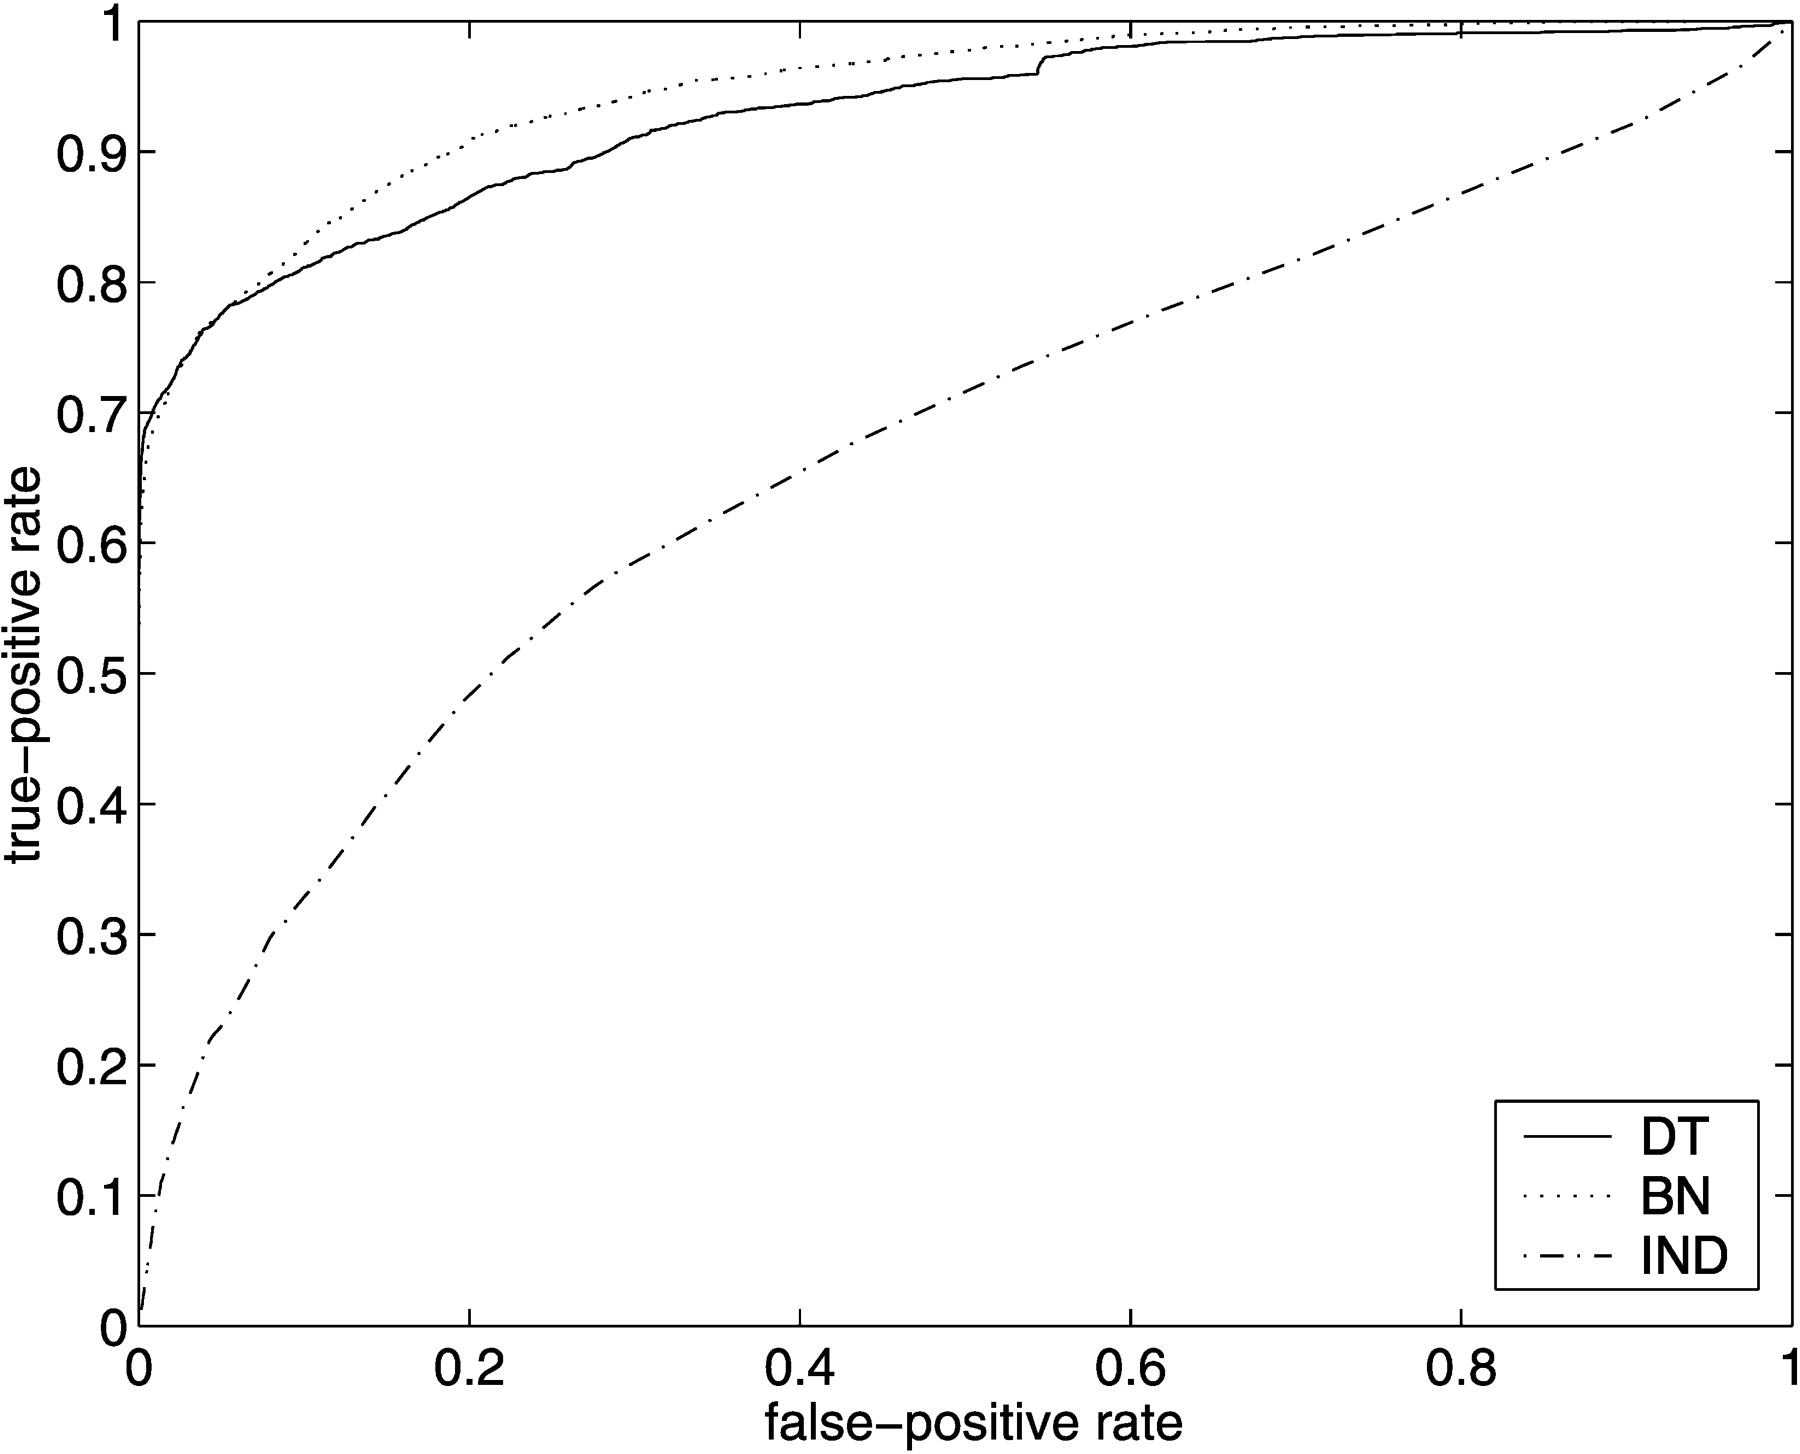
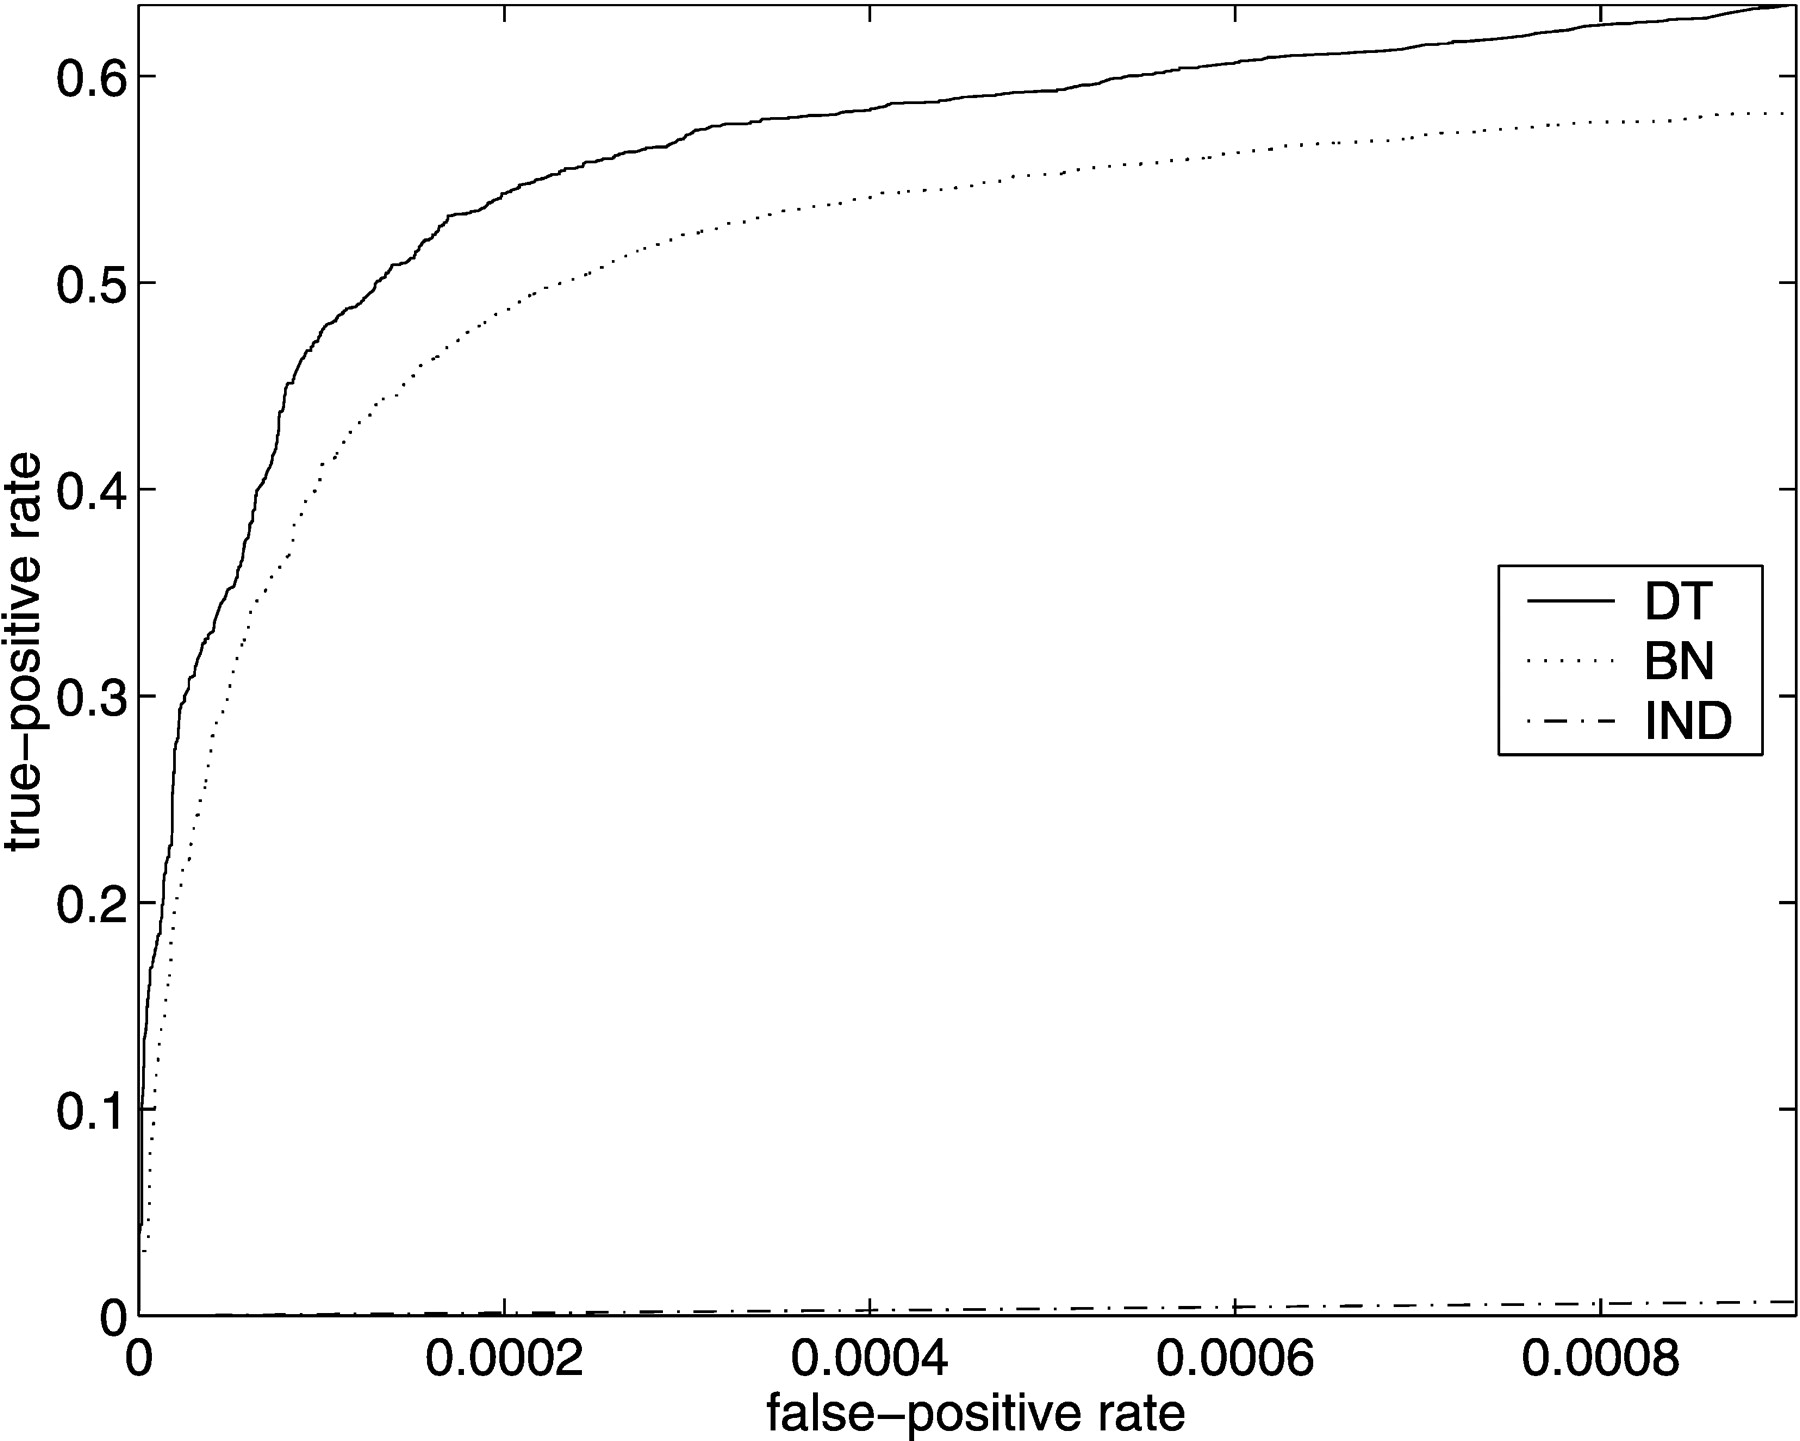
Figure 1.
ROC curves for SGD (above) and FlyBase (below), using models MDT, MBN , andMIND . On the left are the entire ROC curves, and on the right are details of the ROC curves at low false-positive rates, with the axes rescaled. (Note that in the graphs on the right, the curves for MIND are not missing; they are just very close to the horizontal axis.)


