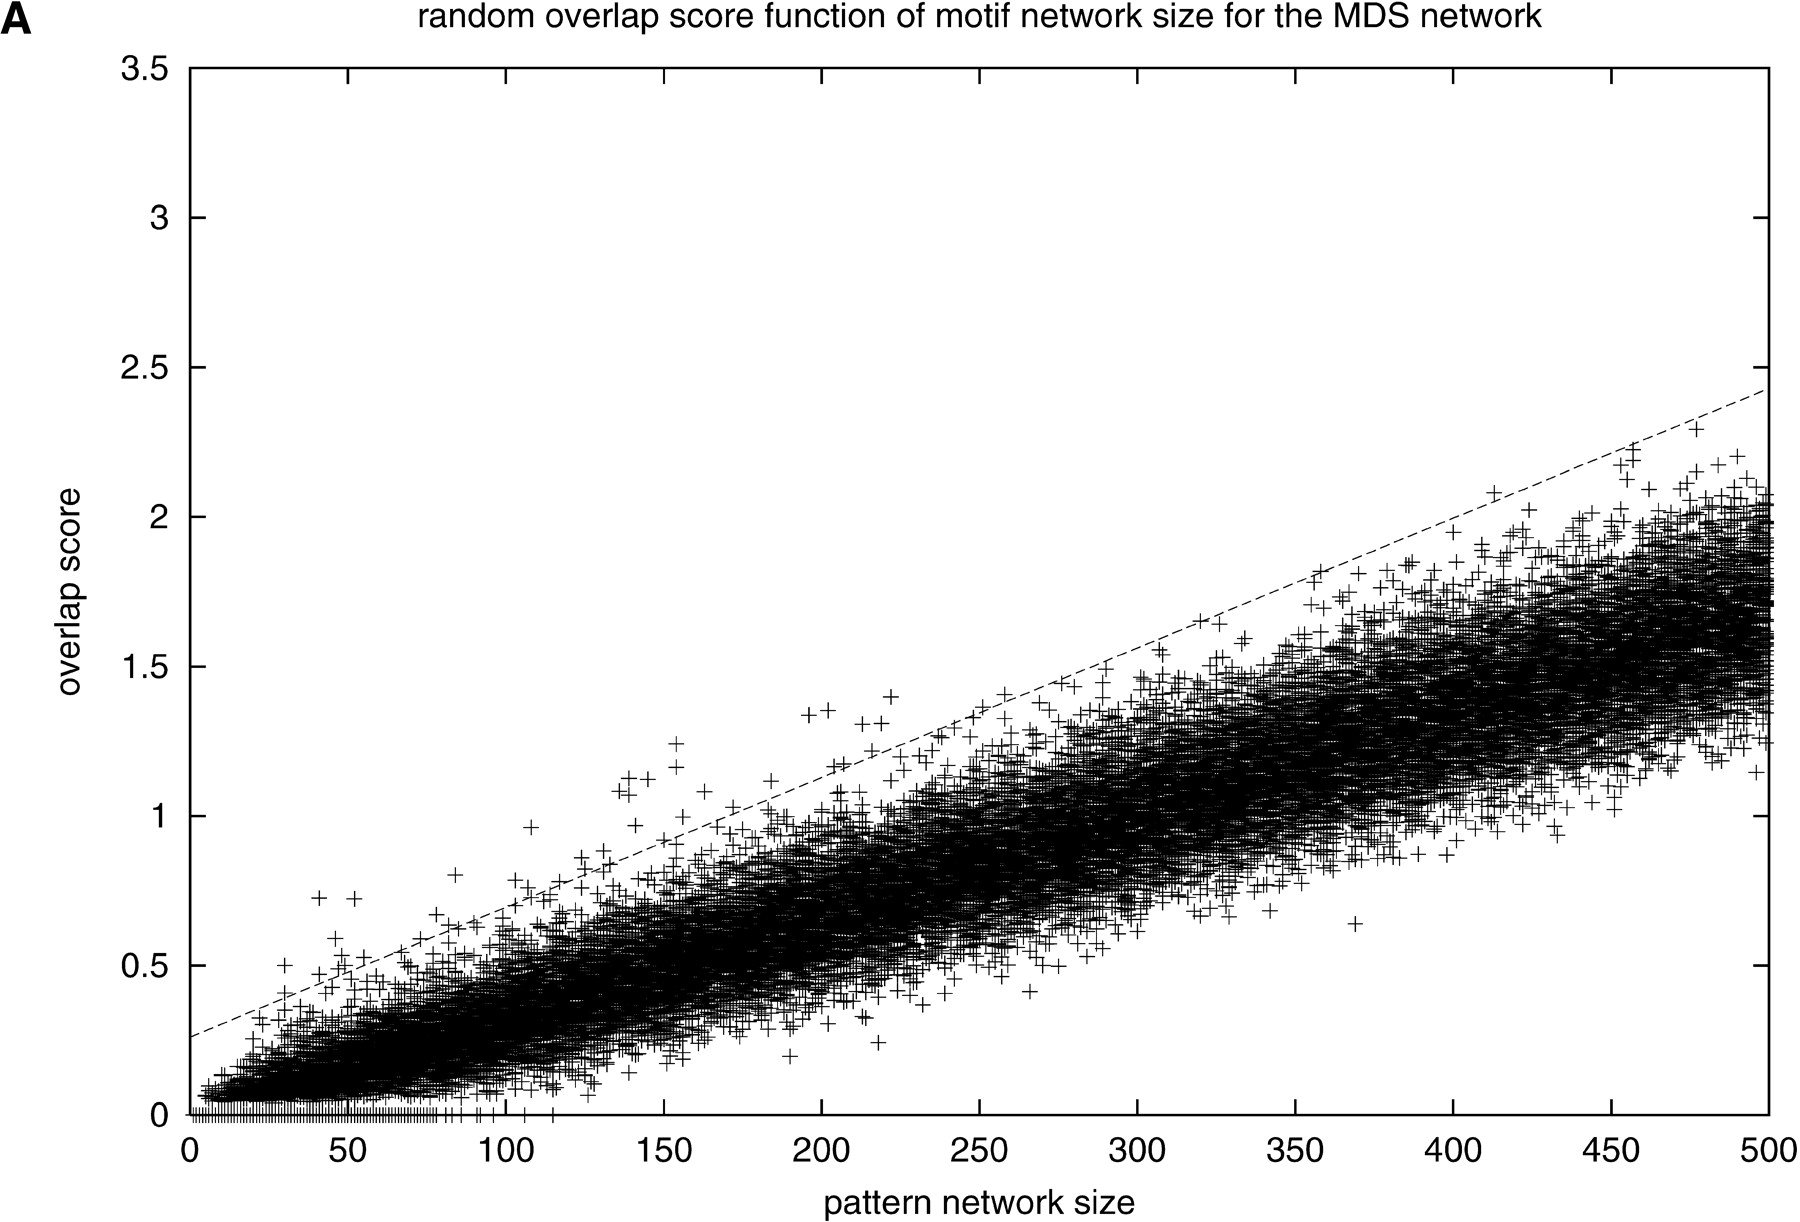
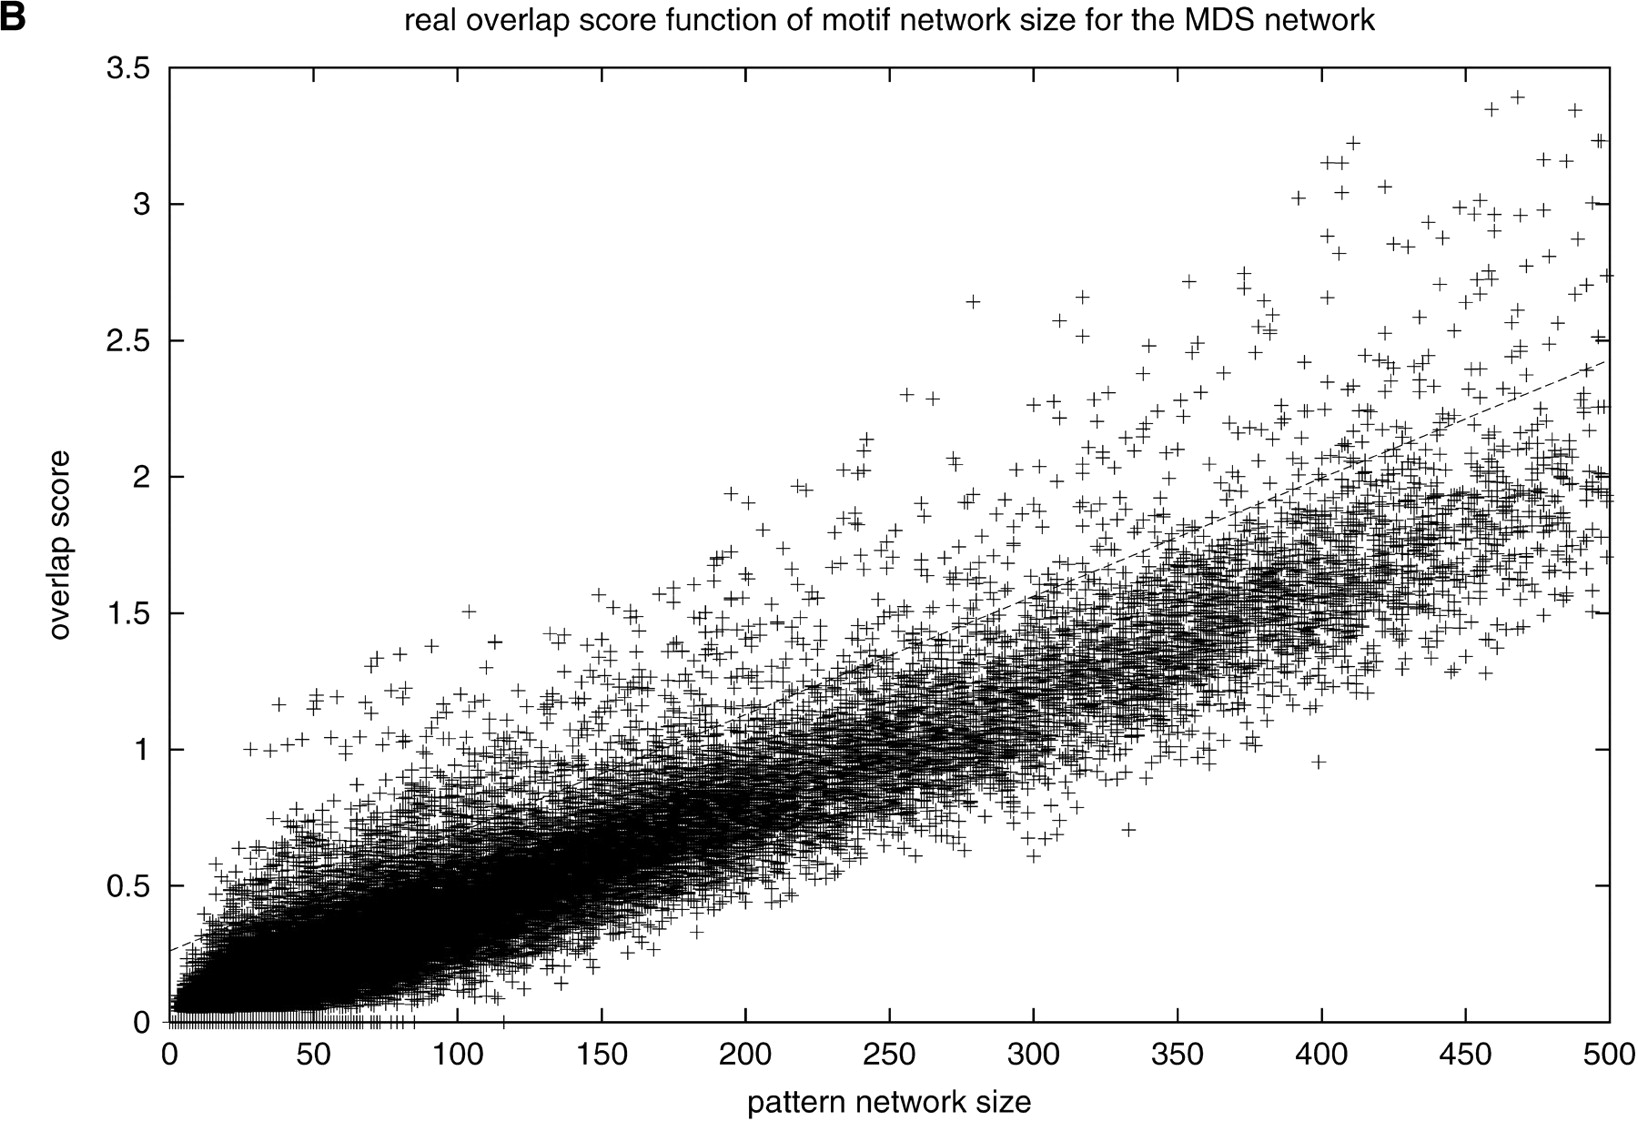
Discovering Novel cis-Regulatory Motifs Using Functional Networks

(Downloading may take up to 30 seconds. If the slide opens in your browser, select File -> Save As to save it.)

Click on image to view larger version.

Figure 3.Figure 3.
Figure 3.

Overlap score with (A) MDS random network and (B) MDS real network. The lines correspond to the average four standard deviations to the mean for the random pattern overlap with regression equation Y = 0.004336X + 0.2613.

This Article

  1. Genome Res. 13: 883-895

Preprint Server