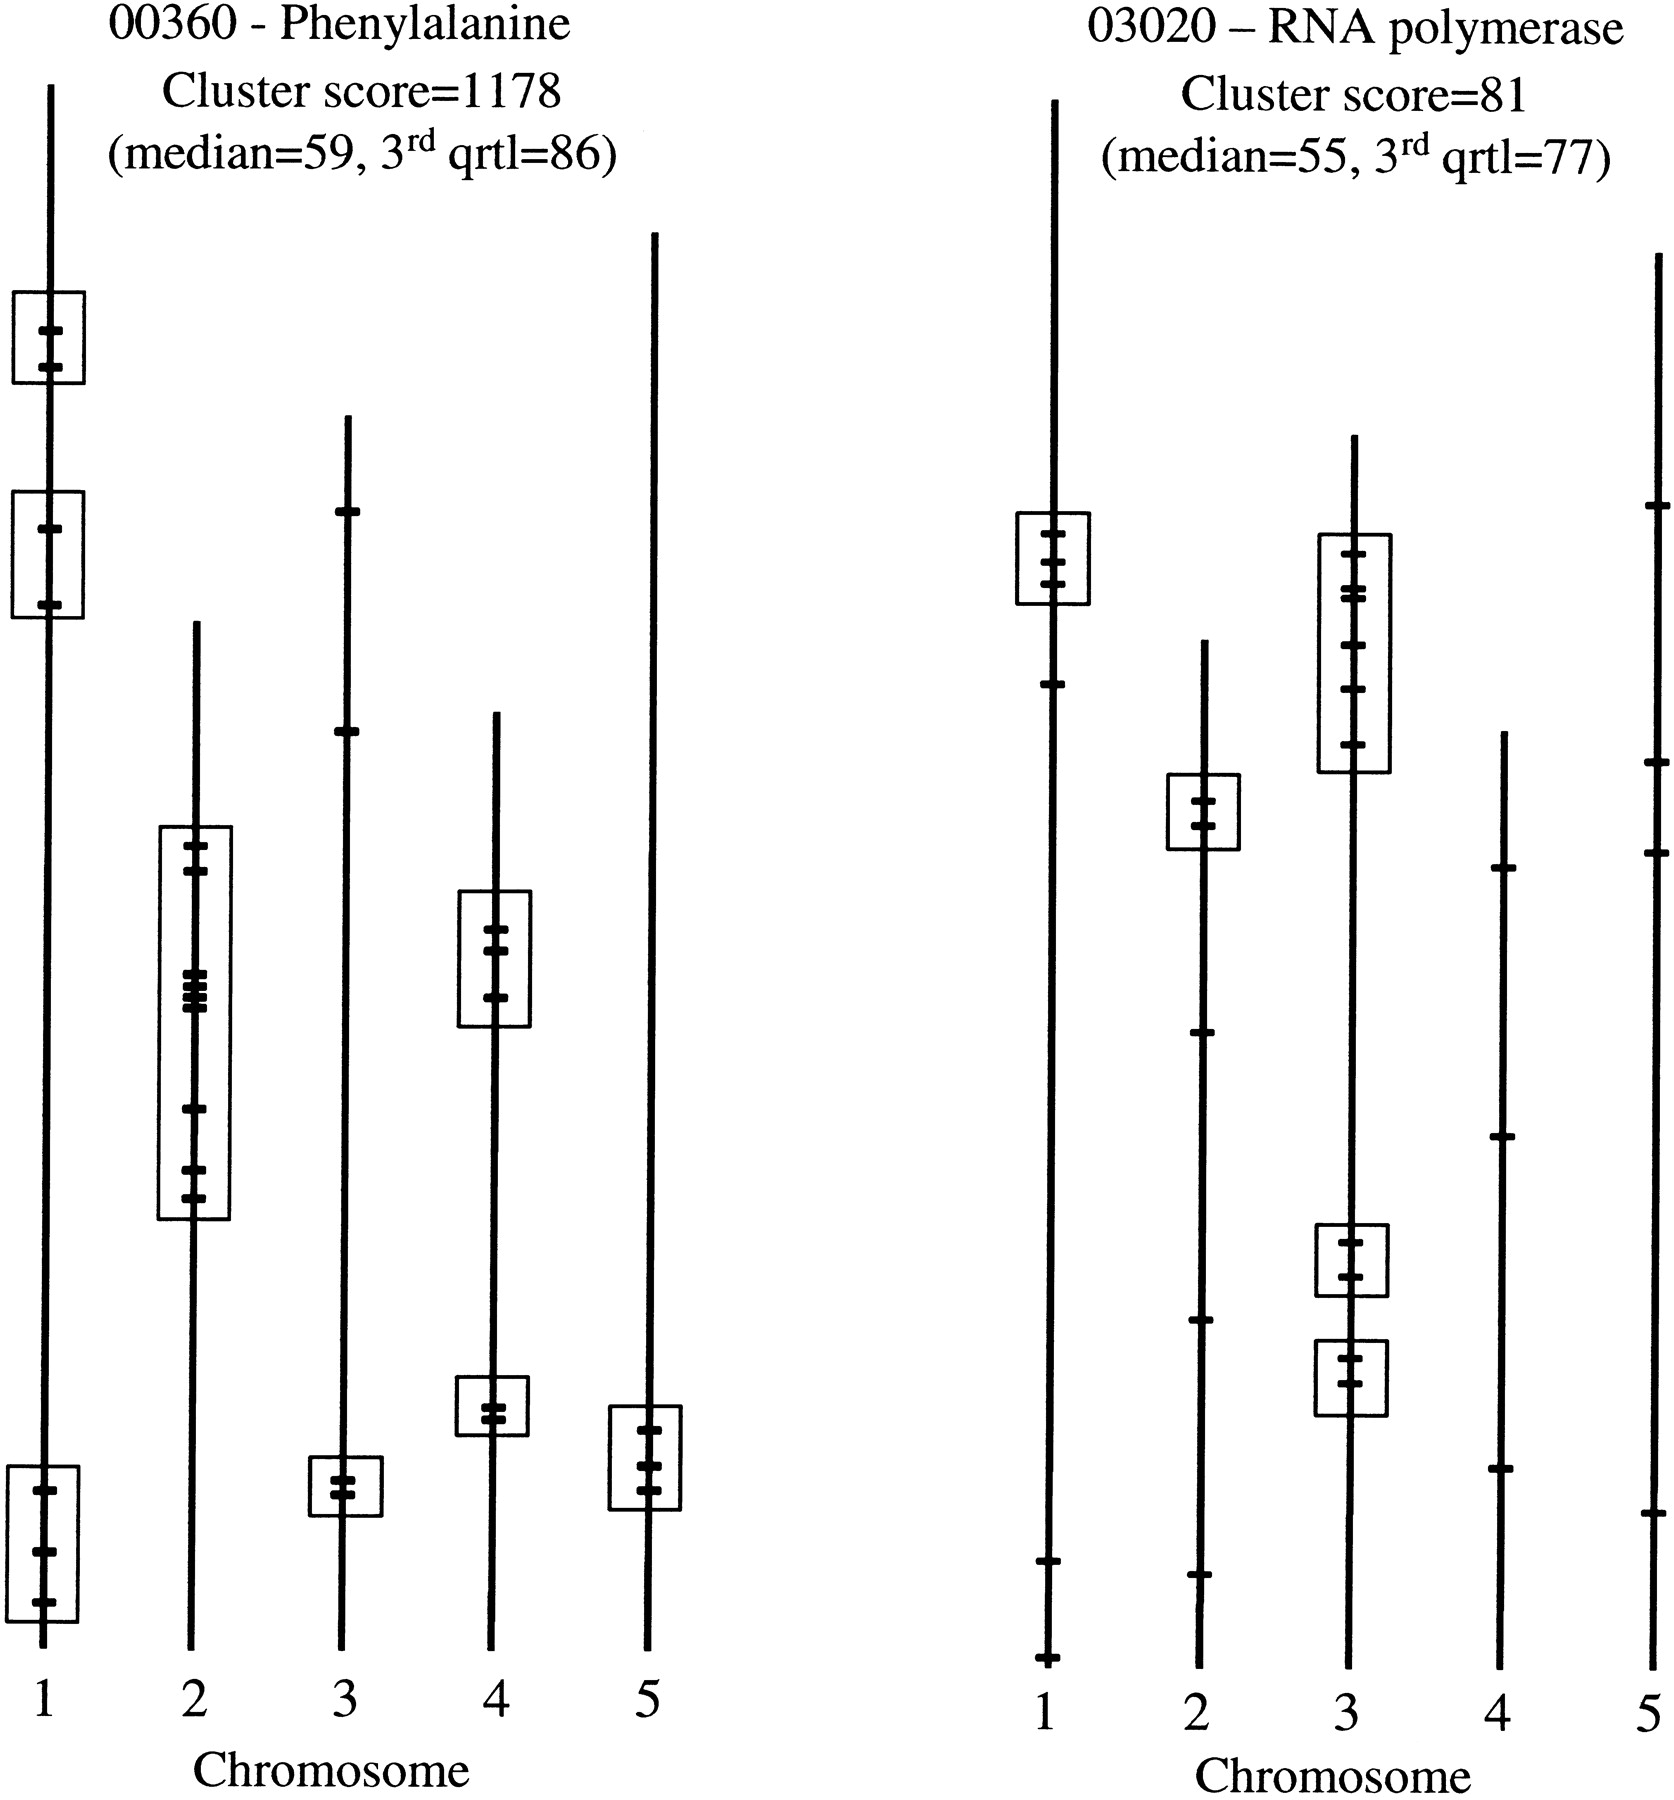
Genomic Gene Clustering Analysis of Pathways in Eukaryotes

(Downloading may take up to 30 seconds. If the slide opens in your browser, select File -> Save As to save it.)

Click on image to view larger version.

Figure 3.
Figure 3.

Distribution of genes in pathways with and without significant clustering in A. thaliana. Pathway 00360 has a highly significant clustering score, whereas pathway 03020 does not. Merged data were used. The boxes represent putative loose gene clusters.

This Article

  1. Genome Res. 13: 875-882

Preprint Server