
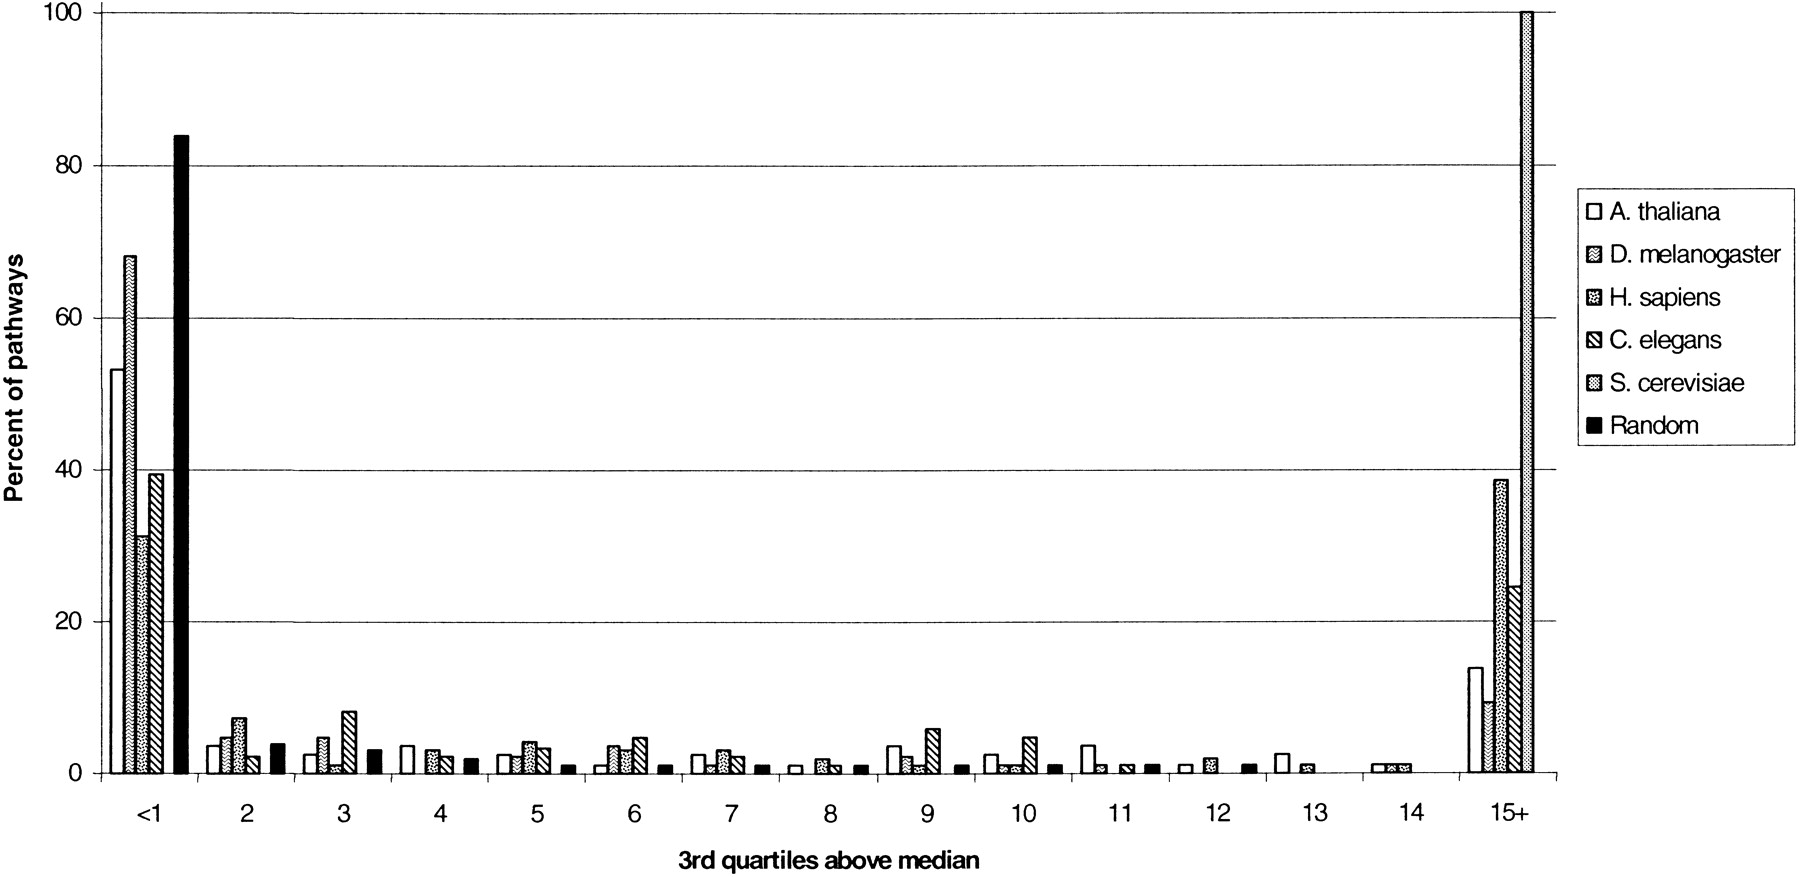
Figure 2.
Distribution of pathway clustering scores (using merged data). Thex-axis represents how much higher from the median the score is in terms of difference between the median and the 3rd quartile. Also shown is the score distribution from randomly chosen pathways (from all organisms) in which the genes were picked randomly from all genes in the particular organism.


