
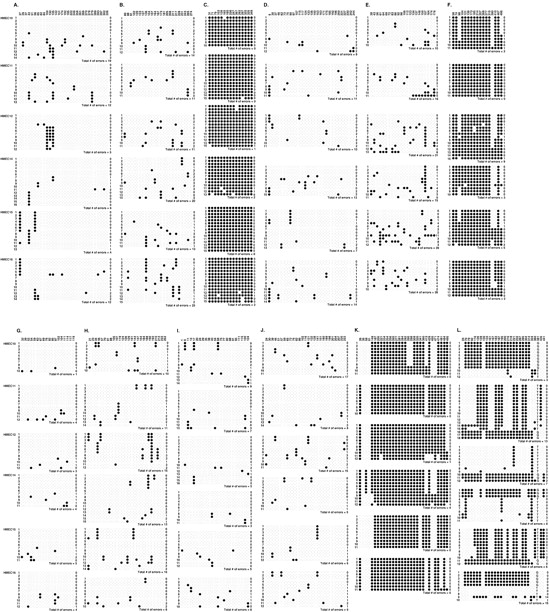
Distribution of unmethylated and methylated CpG sites shown by bisulfite sequencing. Unmethylated and methylated CpG sites are shown by open and closed circles, respectively. (A)–(C) A CGI in the promoter region, a CGI outside the promoter region and CpG sites in non-CGIs of the E-cadherin gene. (D)-(F) A CGI in the promoter region, a CGI outside the promoter region and CpG sites in non-CGIs of the p41-Arcgene. (G), (H) A CGI in the promoter region and a CGI outside the promoter region of the SIM2 gene. (I) A CGI in the promoter region of the 3-OST-2 gene. (J) A CGI in the promoter region of the Cyclophilin A gene. (K) A CGI in the promoter region of the MAGE-A3 gene, which is normally methylated. (L) A CGI in the differentially methylated region of the H19 gene.


