
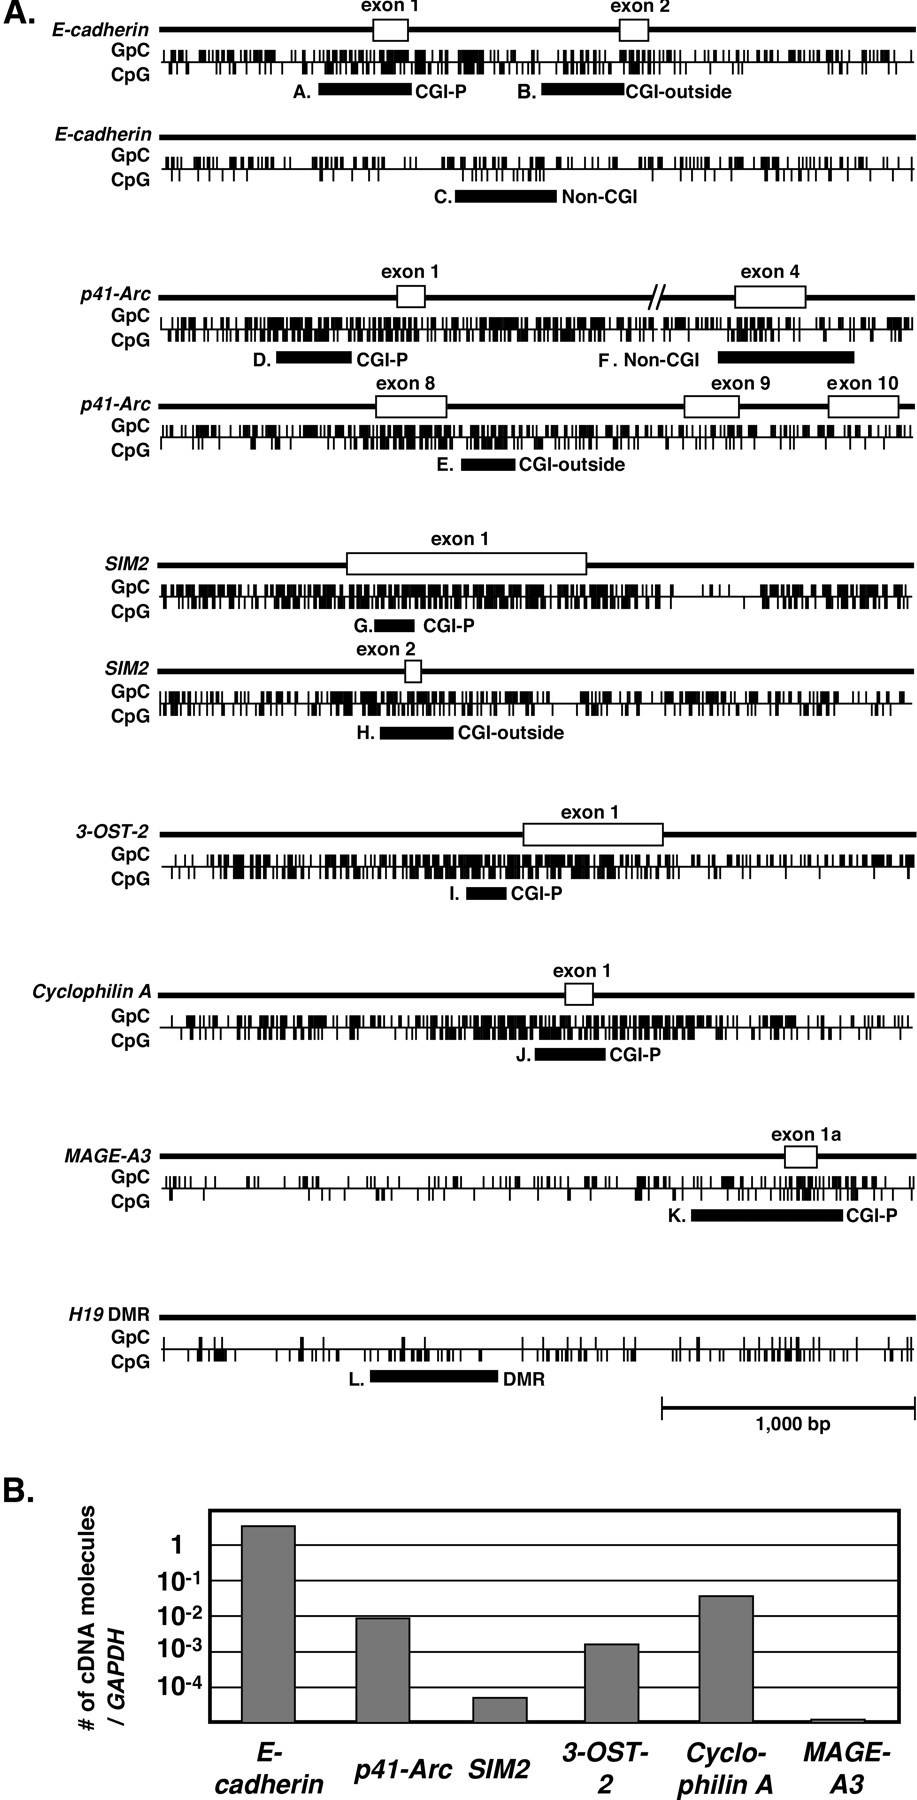
Figure 2.
Structures and expressions of the genes analyzed. (A) Schematic representation of the genomic regions analyzed. Regions analyzed by bisulfite sequencing are shown by closed boxes, and designations A–L correspond to panels in Fig. 3. CGI-P: a CGI in the promoter regions; CGI-outside: a CGI outside the promoter regions; Non-CGI: CpG sites outside CGIs; and DMR: differentially methylated region. All panels are drawn to the same scale. (B) Expression levels of the seven genes in HMECs.


