
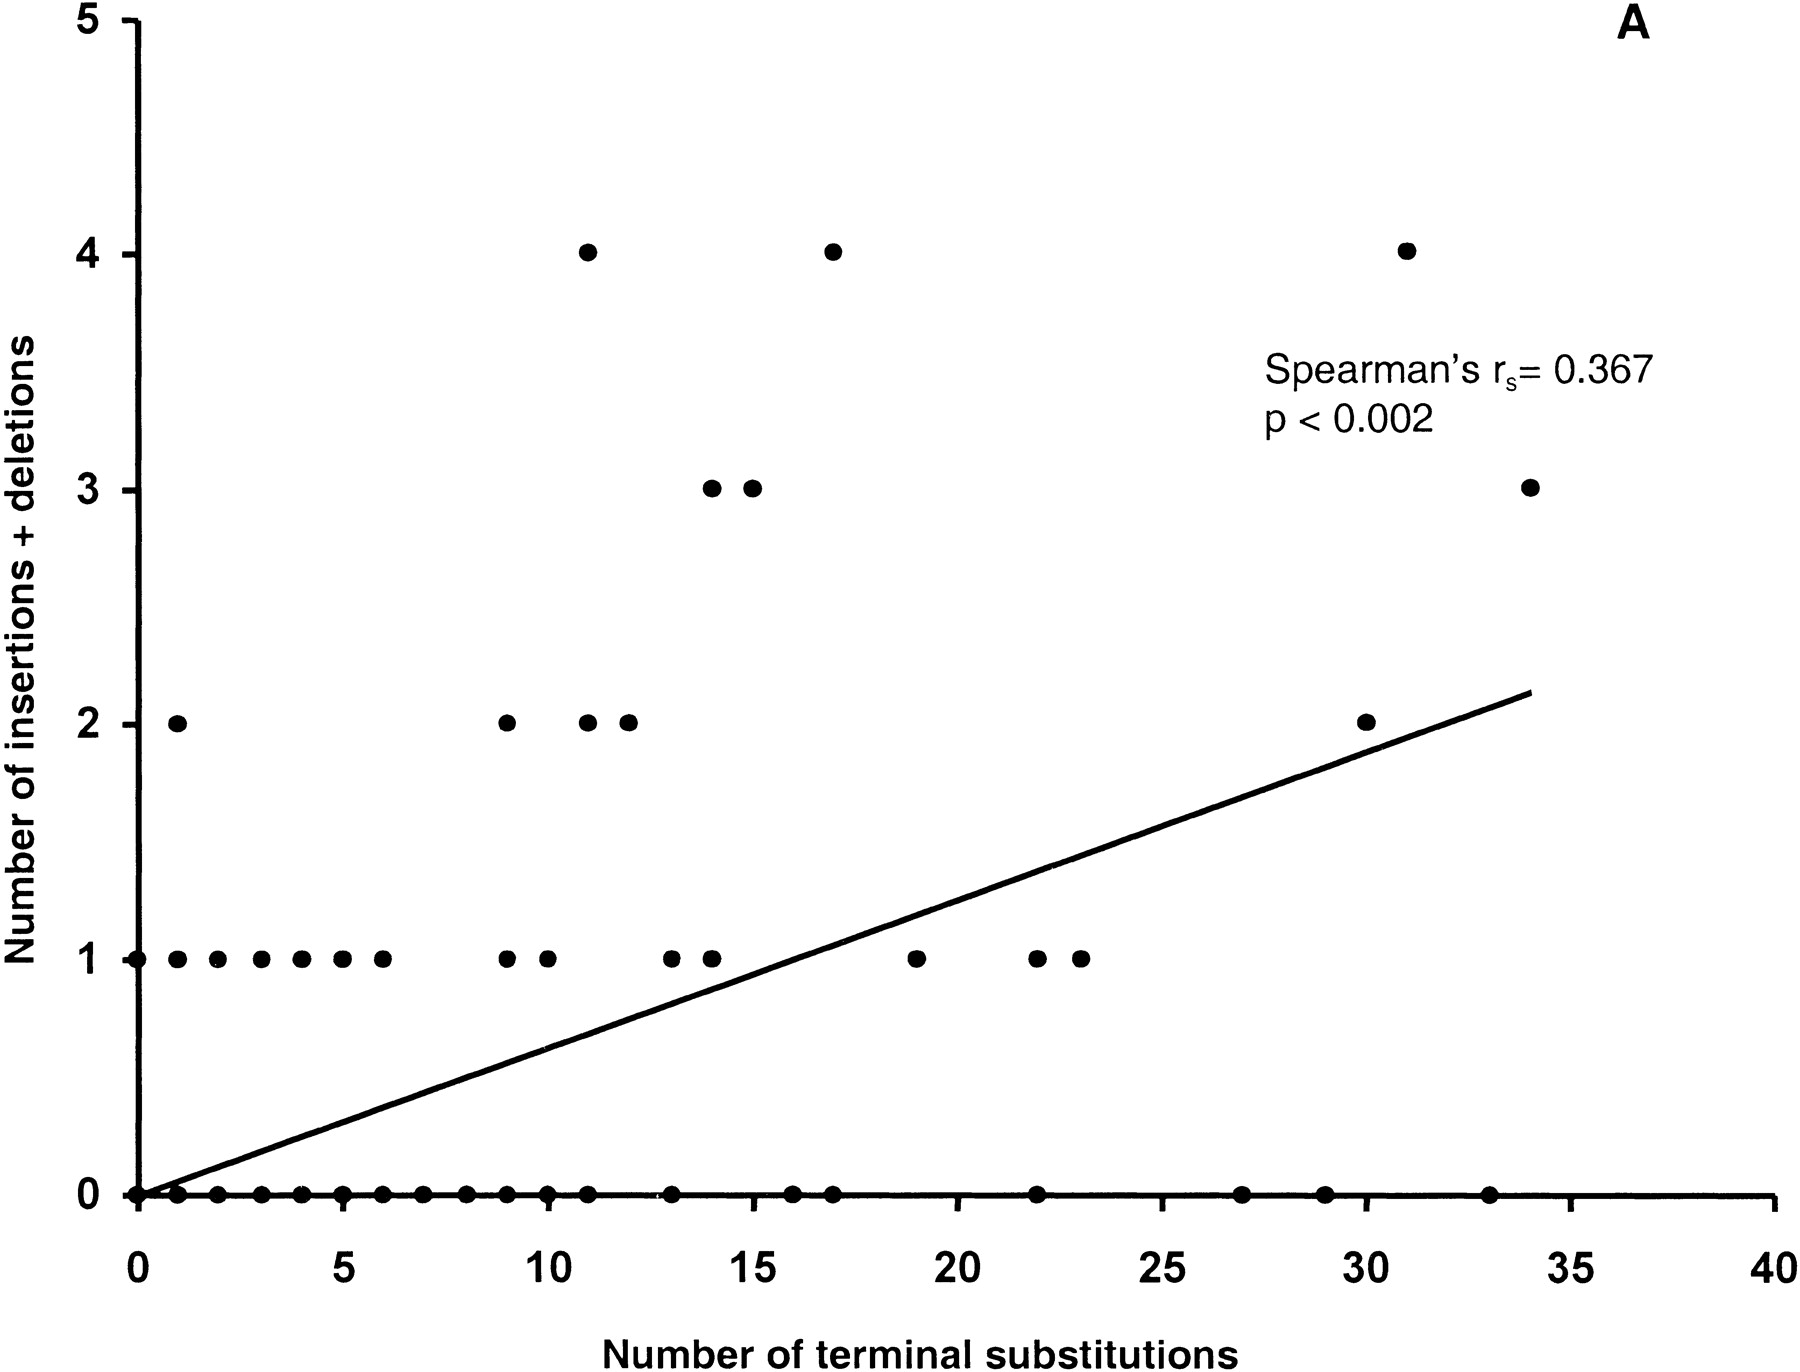
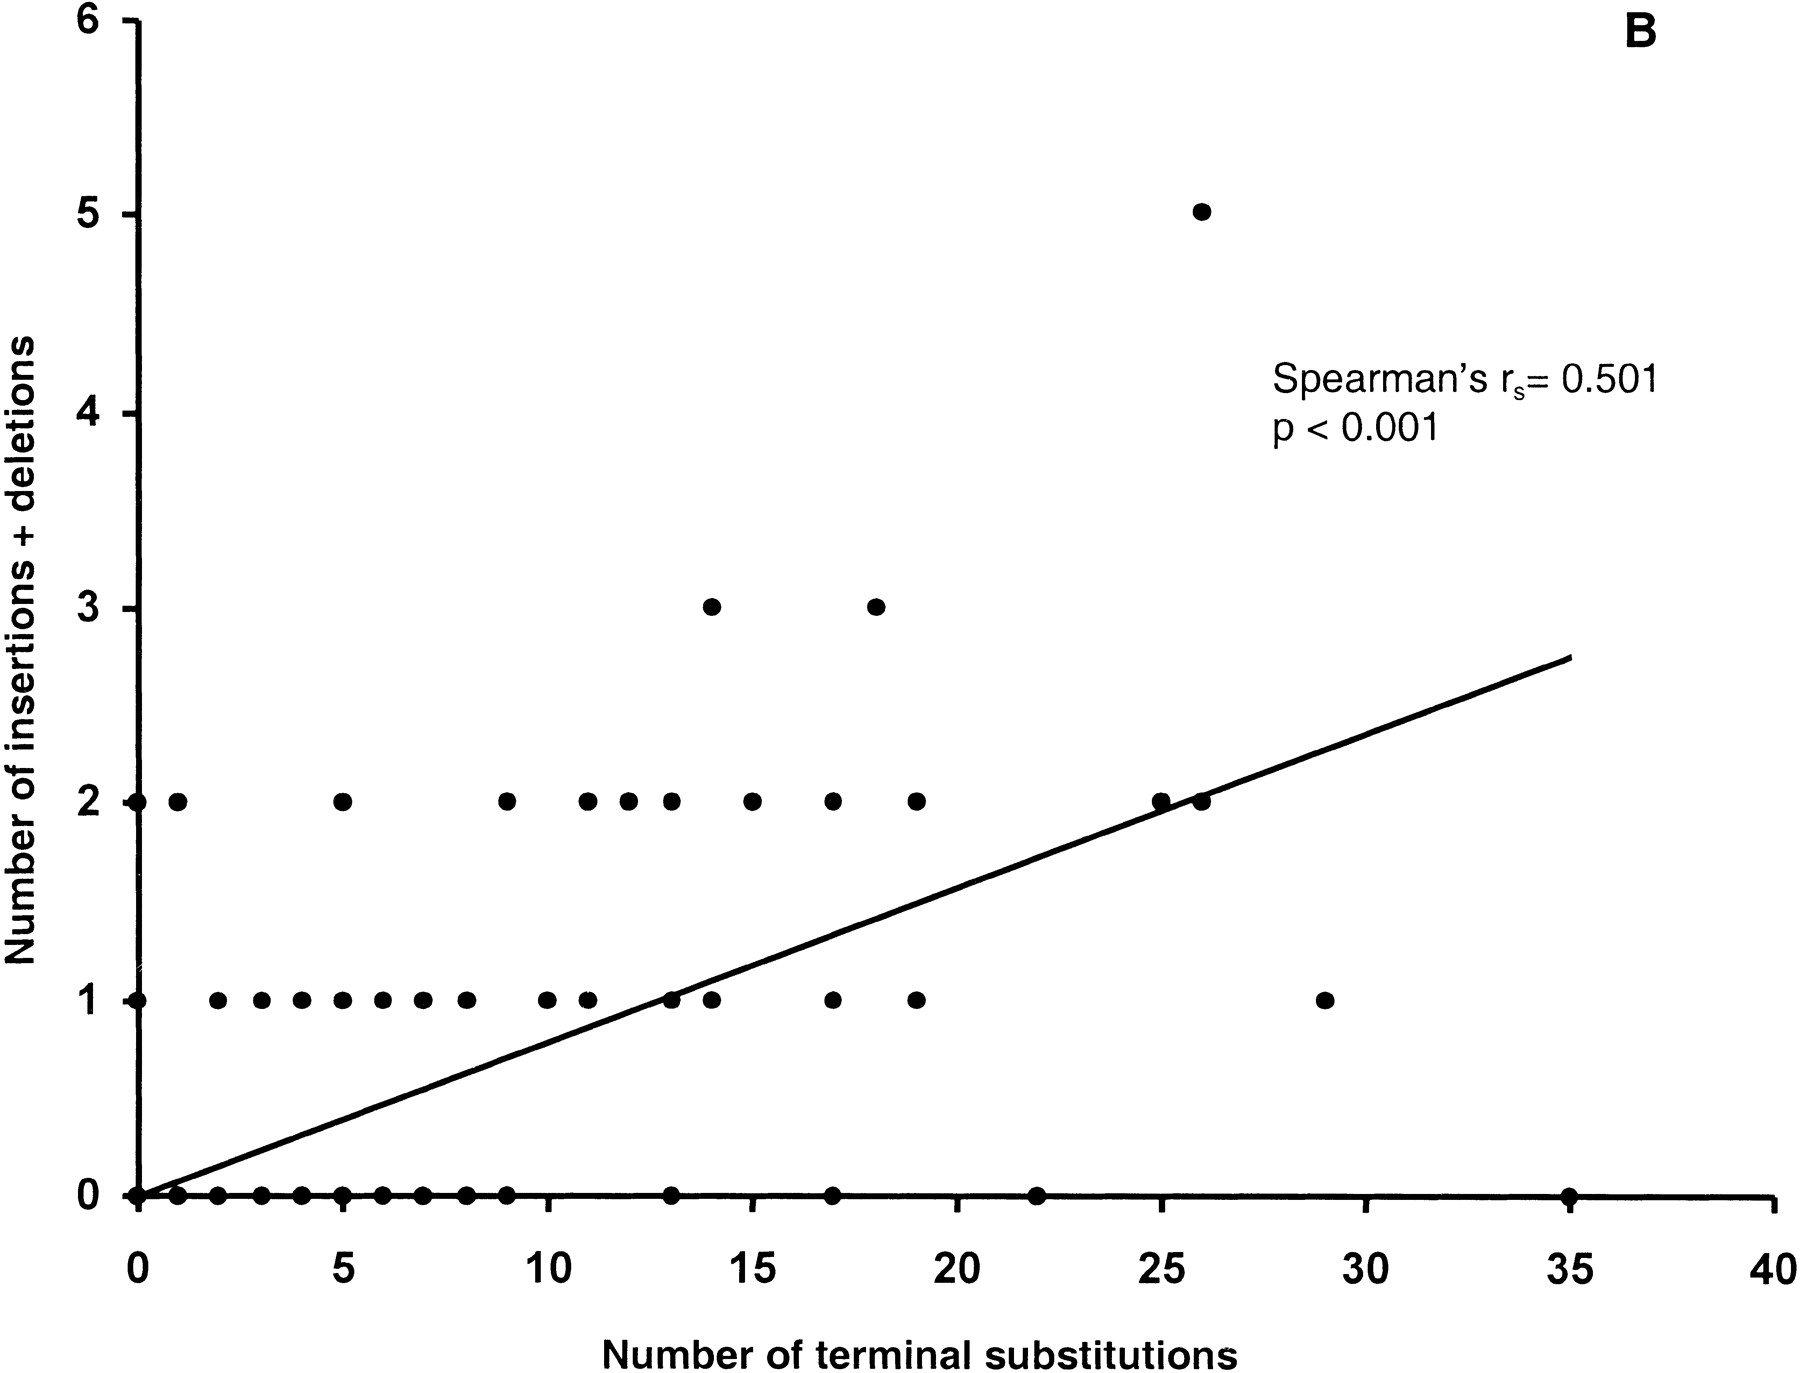
Figure 3.
Number of terminal indels in individual sequences plotted against the number of terminal nucleotide substitutions in each sequence for the tetraodontid (A) and diodontid (B) data sets. Lines are linear regressions with the intercept fixed at 0. A significant correlation is detected in both plots using Spearman's rank correlation statistic.


