
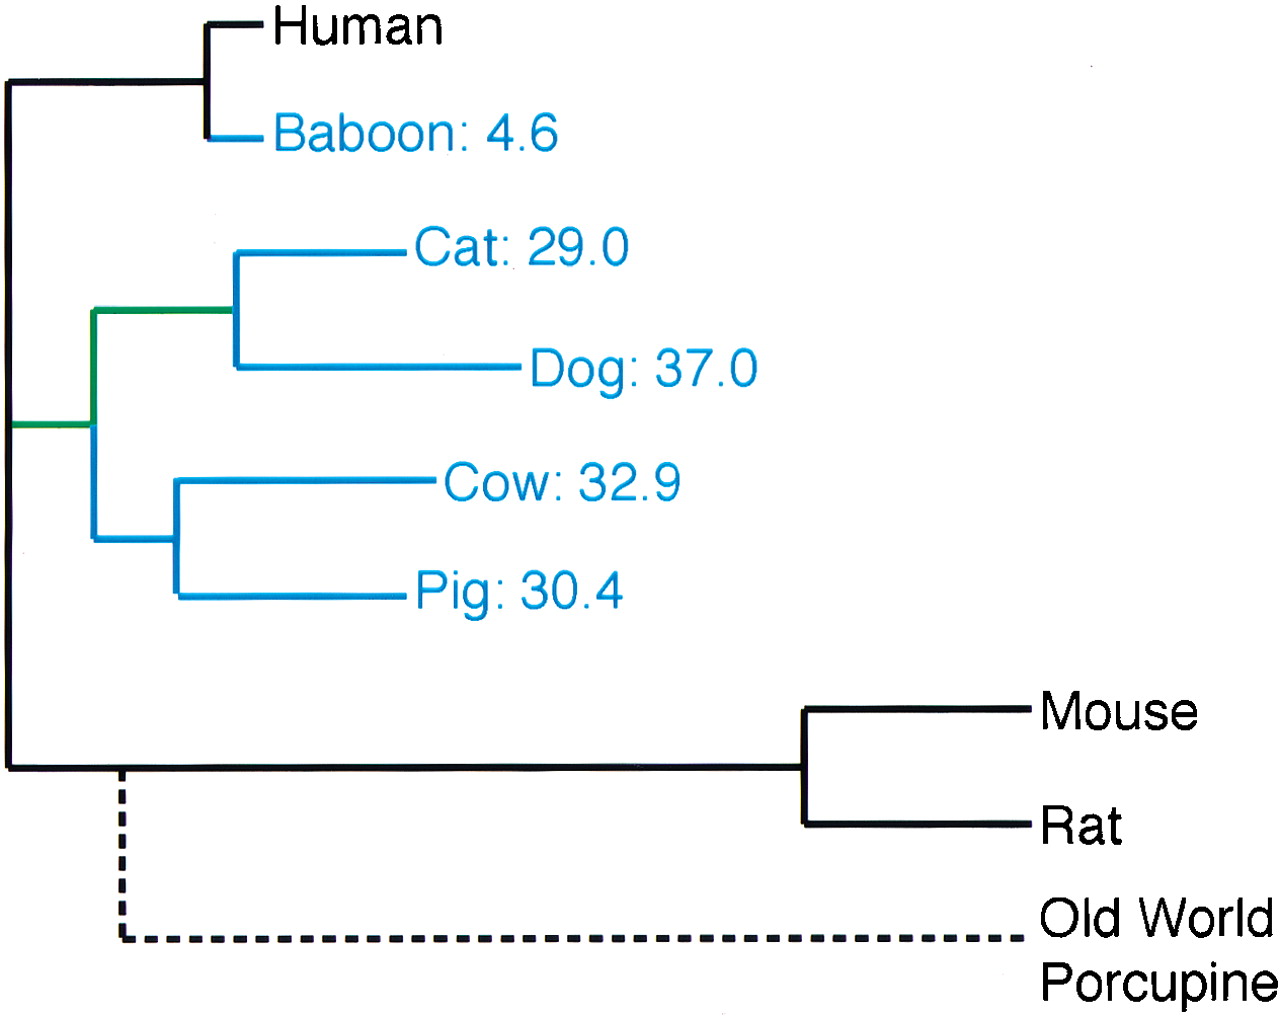
Tree, drawn to scale, of the number of substitutions per site averaged over all data sets, with sequenced genomes in black and the other species of this study in blue. Estimates of the relative amount of additional substitutions per site that any one of the blue organisms would add are expressed as percentages of what is already present in the sequenced genomes of Human, Mouse, and Rat. Lineages shared by dog and cat since their last common ancestor with other mammals are in green. Old world porcupine is added for illustrating the potential of other mammalian genomes. The length of its branch (broken line) is based on BRCA1 exon 11.


