
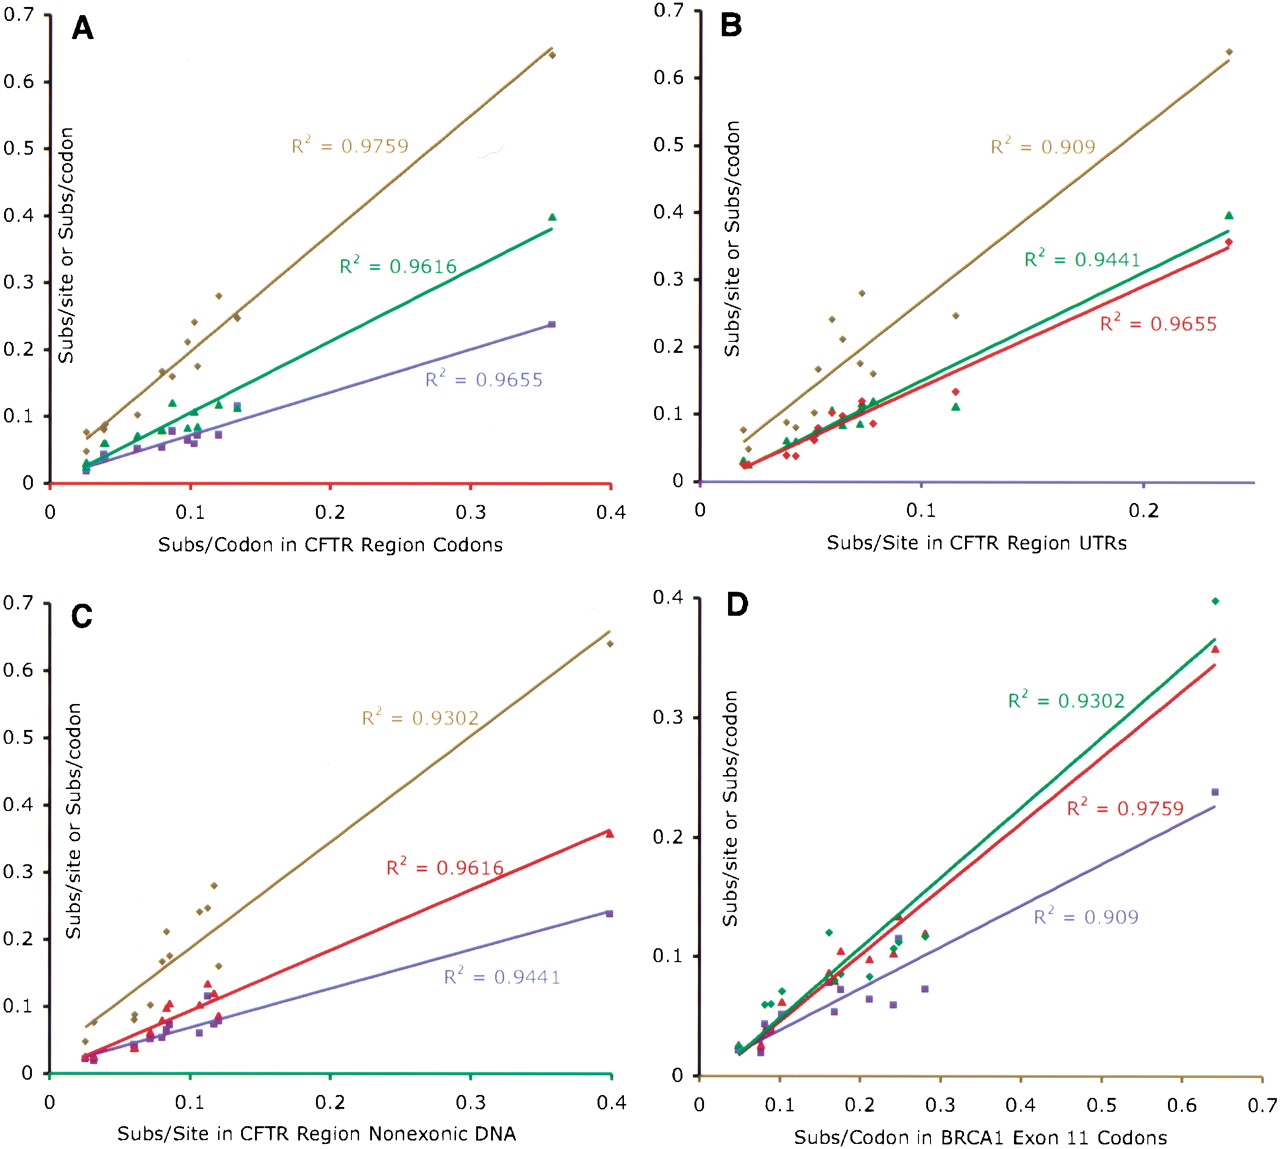
Correlations of the branch lengths in the tree of one data set with the branch lengths of the trees of the other data sets. Each point corresponds to the comparison of one branch's length in one data set vs. that branch's length in another data set. Data sets are color coded. (Red) CFTR region codons; (Blue) CFTR region UTRs; (Green) CFTR region non-exonic DNA; (Brown)BRCA1 codons. Trendlines and coefficients of determination were generated by regressing the branch lengths of one data set against the branch lengths of the other data sets. (A) CFTRregion codons versus all others. (B) CFTR region UTRs vs. all others. (C) CFTR region non-exonic DNA vs. all others. (D) BRCA1 Exon 11 codons vs. all others.


