
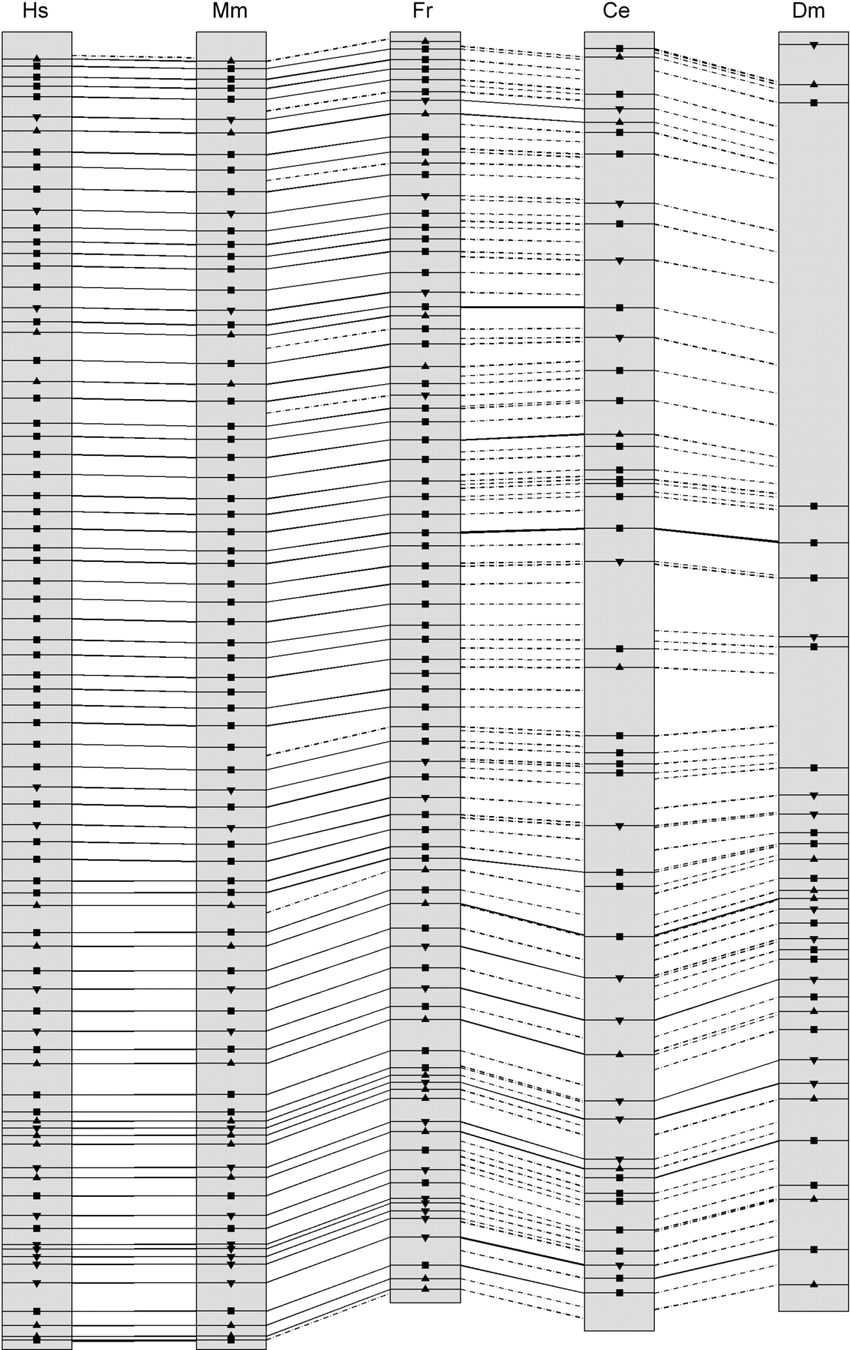
Figure 1.
Gene structure comparison among vertebrate and invertebrate dystrophin genes. Intron positions are indicated as lines interrupting the coding sequences. Continuous lines across two sequences represent identical intron positions (small changes of ±10 nt were ignored; Betts et al. 2001). Hatched lines indicated intron positions that are not conserved. Exon codon phases are also reported and represented as squares or triangles. Squares indicate phase 0; up- and down-pointing triangles indicate phase 1 and phase 2, respectively.


