
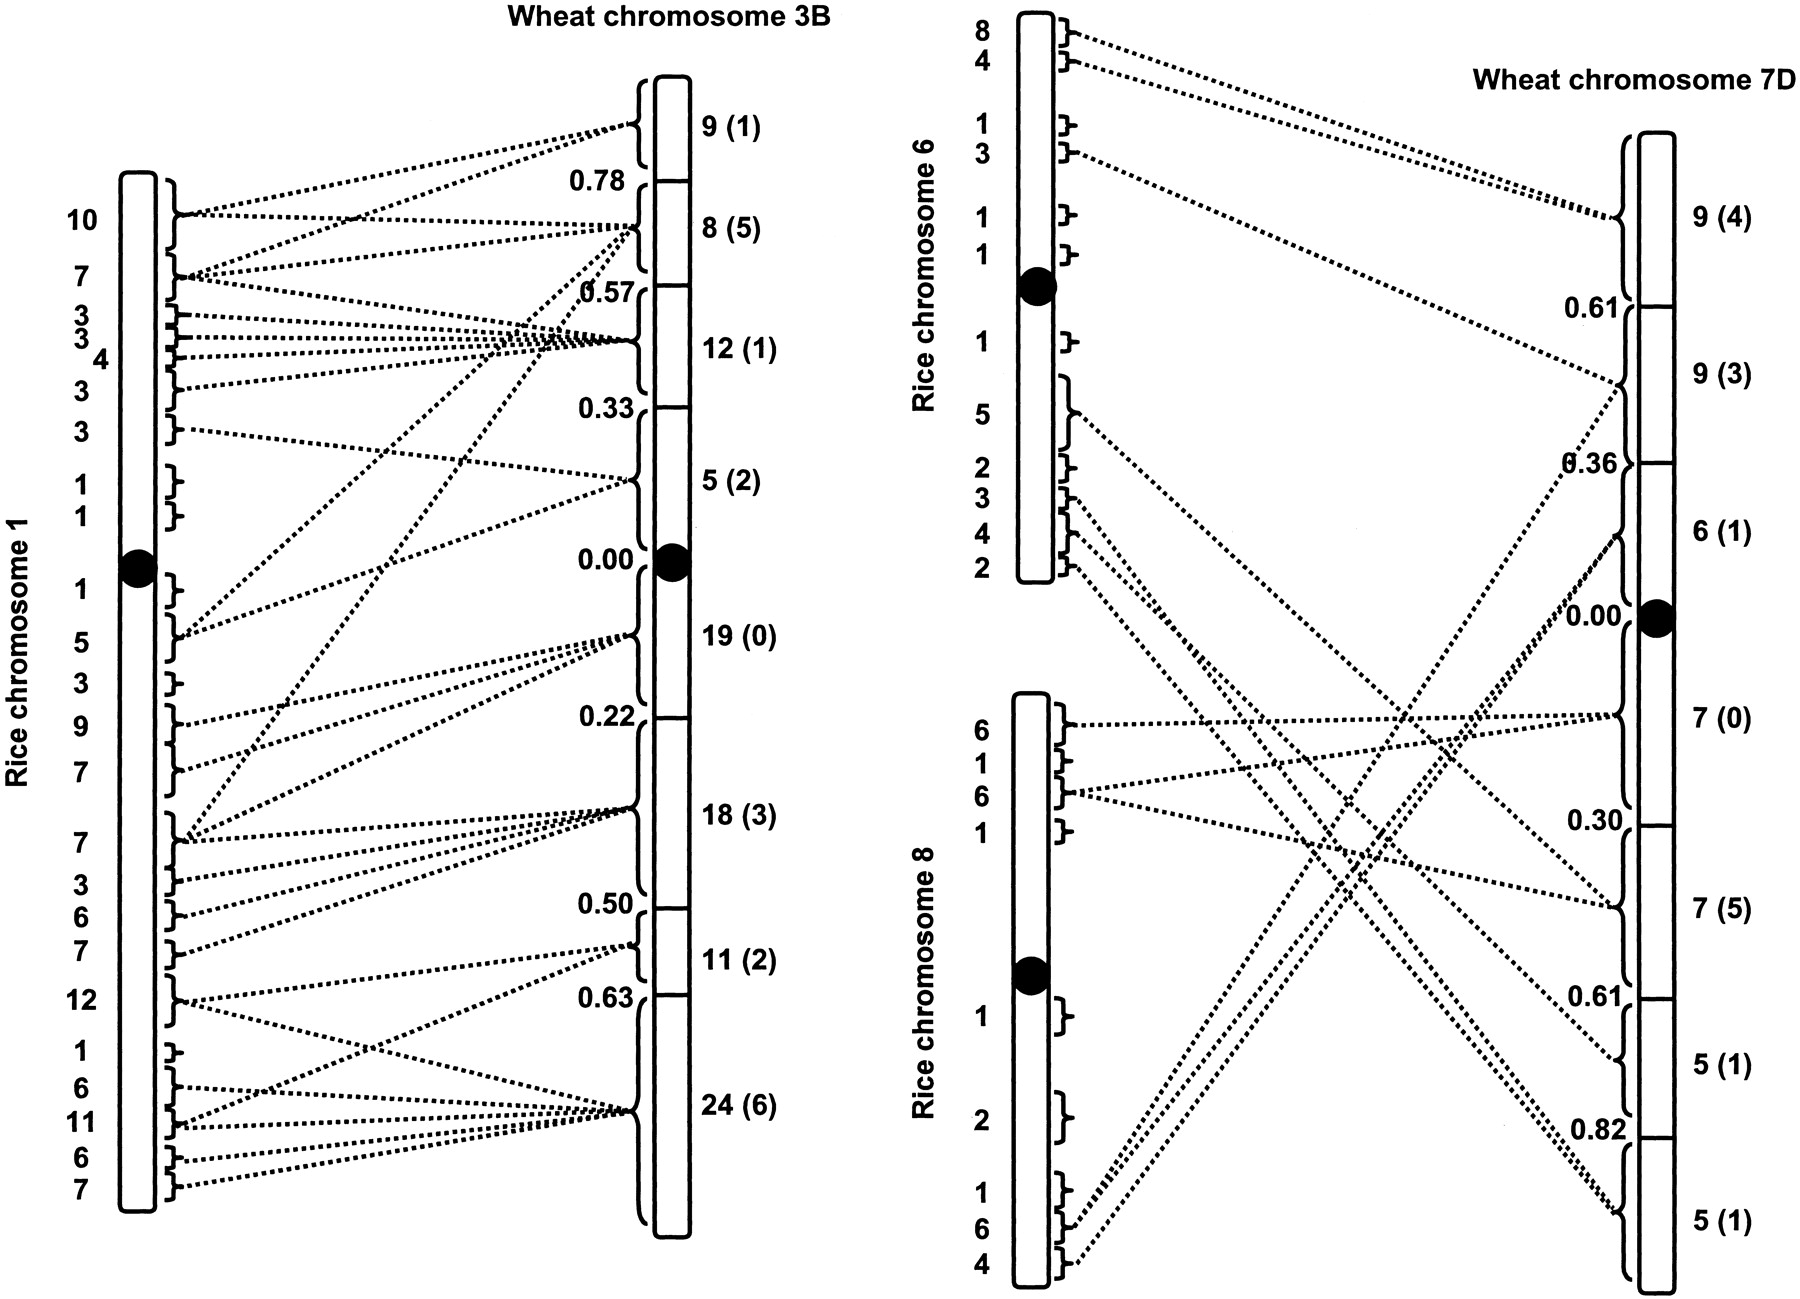
Synteny between wheat chromosome 3B and rice chromosome 1 and wheat chromosome 7D and rice chromosomes 6 and 8. The boundaries of the bins delineated by deletion breakpoints on chromosomes 3B and 7D are indicated by horizontal lines across chromosomes. The distances of the breakpoints from the centromere, expressed as the fraction of arm length, are shown to the left of the breakpoints. The numbers to the right of the wheat chromosomes indicate the numbers of loci detected by ESTs per bin that had orthologous genes on rice homoeologous chromosomes. Numbers of wheat/rice orthologous loci that are members of wheat paralogous sets are indicated in parentheses. Wheat bins and rice contigs (indicated by brackets) containing two or more orthologous loci are connected by dotted lines. Rice contigs containing only a single putative ortholog are unconnected. The numbers of wheat/rice orthologs within each rice contig are indicated to theleft of rice chromosomes. The black circles indicate centromeres.


