
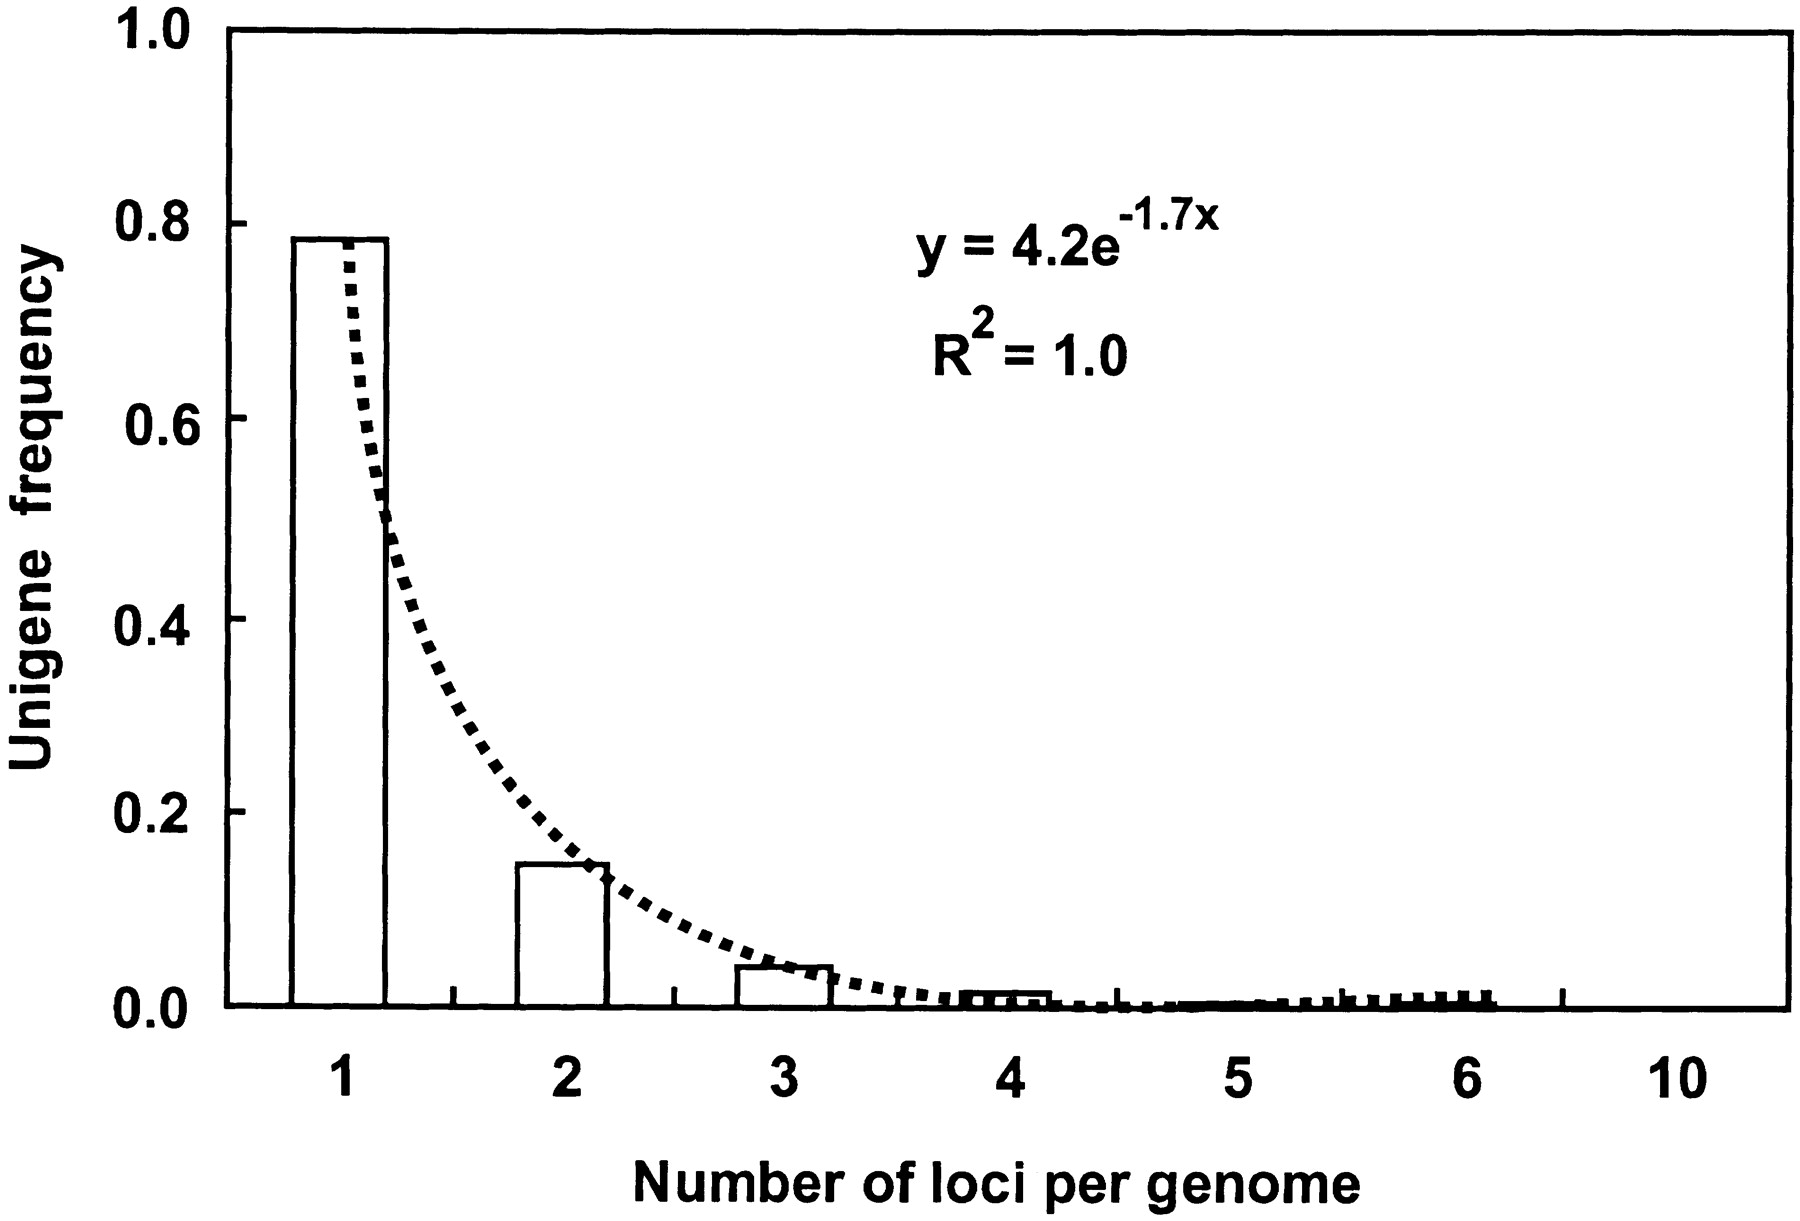
Figure 4.
Frequencies of EST unigenes detecting the indicated numbers of loci within a genome. The curve and the exponential equation best fitting the data are shown.
(Downloading may take up to 30 seconds. If the slide opens in your browser, select File -> Save As to save it.)
Click on image to view larger version.
Frequencies of EST unigenes detecting the indicated numbers of loci within a genome. The curve and the exponential equation best fitting the data are shown.
 CiteULike
 Delicious
 Digg
Digg Facebook
 Google+
 Reddit
 Twitter
