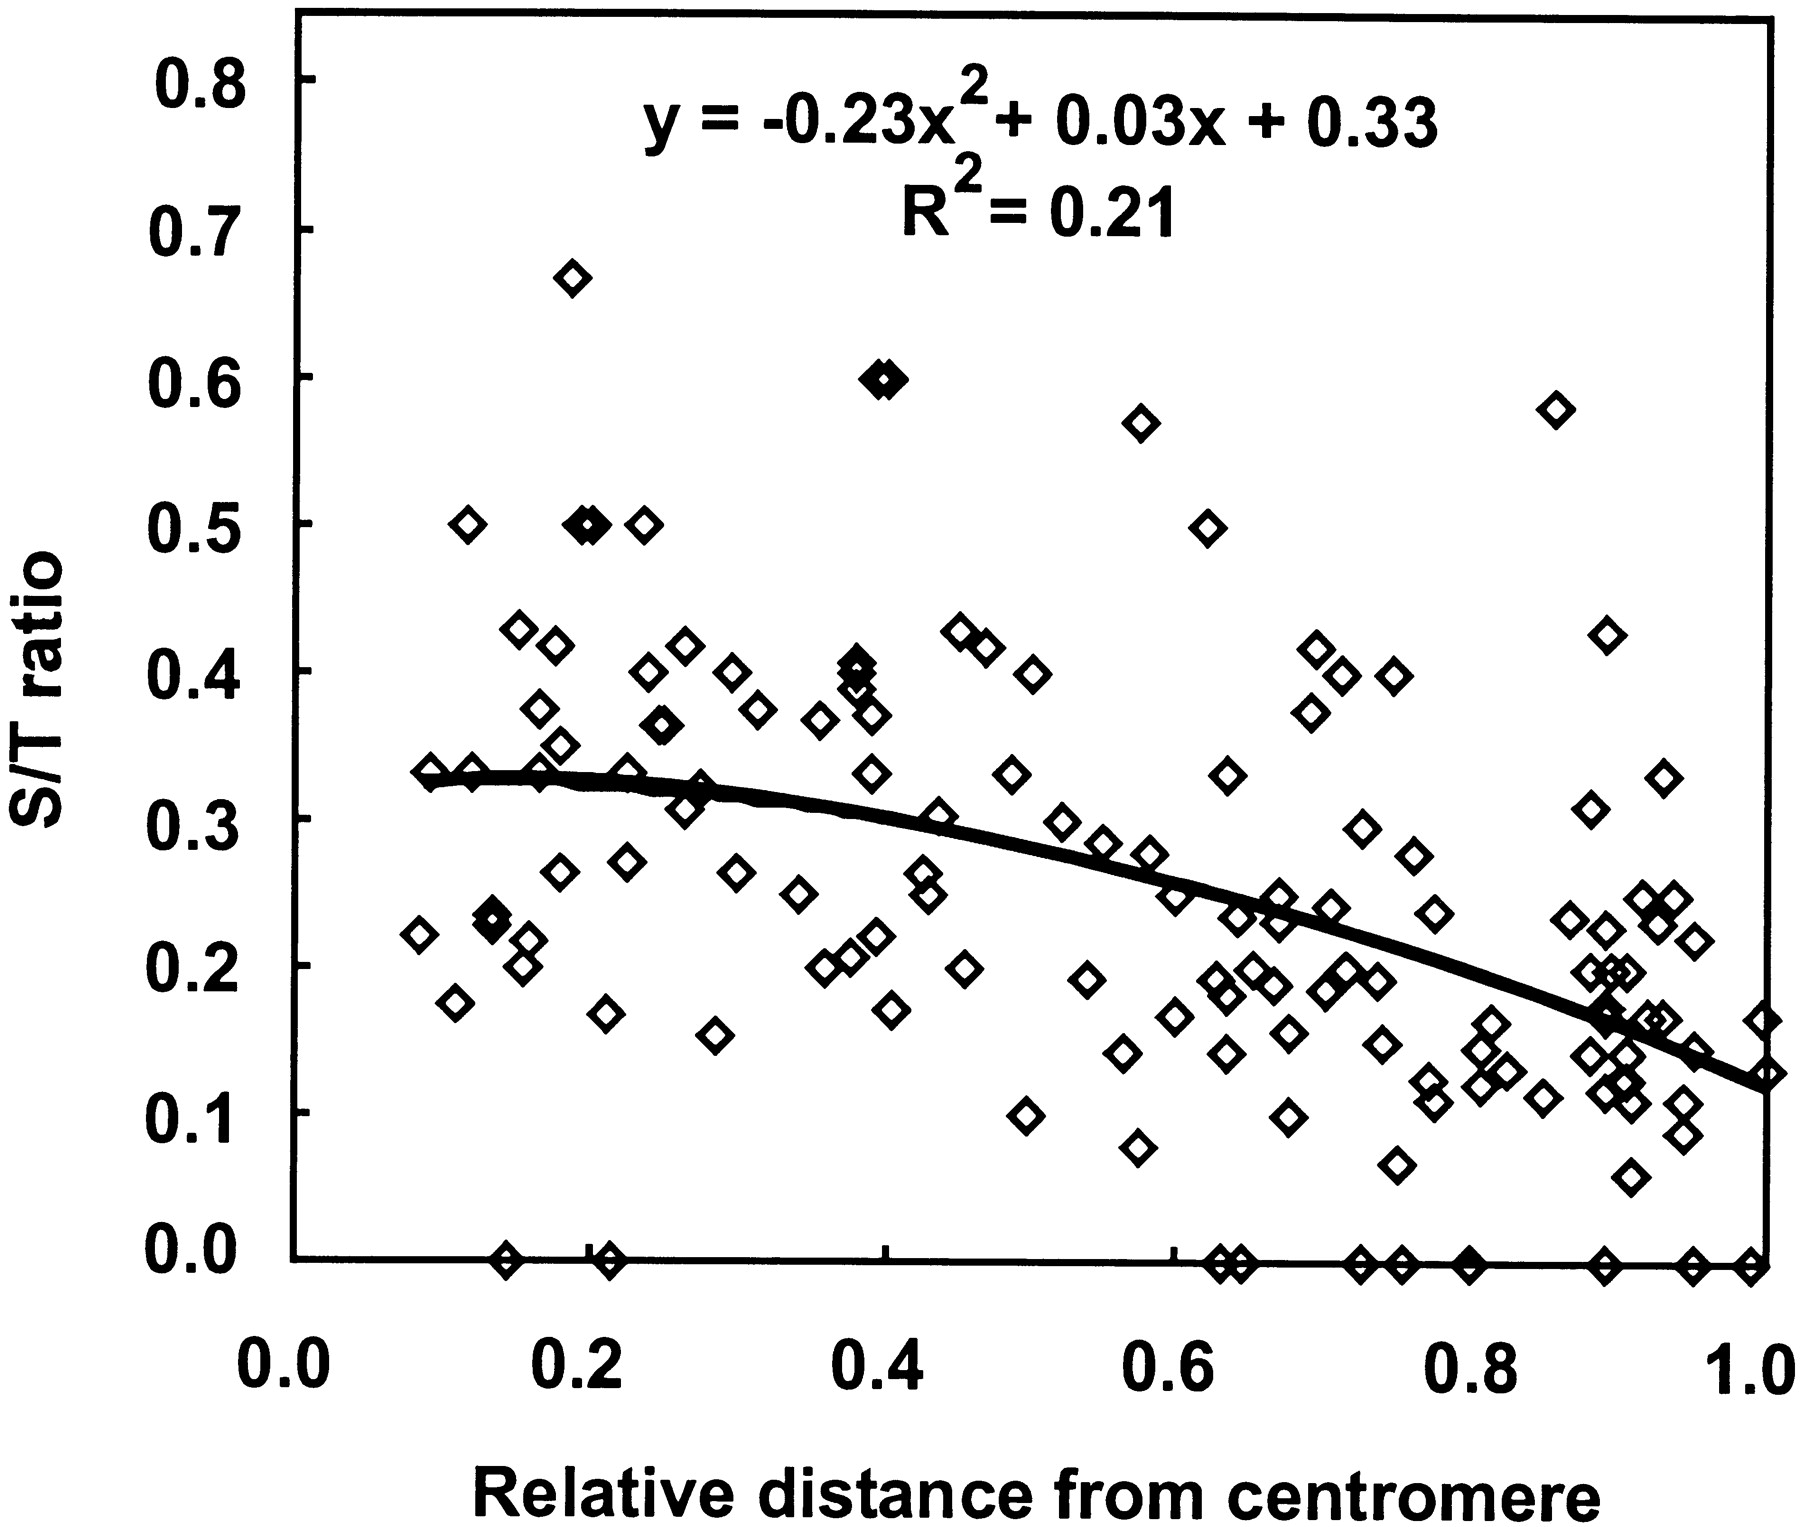
The Organization and Rate of Evolution of Wheat Genomes Are Correlated With Recombination Rates Along Chromosome Arms

(Downloading may take up to 30 seconds. If the slide opens in your browser, select File -> Save As to save it.)

Click on image to view larger version.

Figure 3.
Figure 3.

Relationship between relative frequencies of single-gene loci (S/T ratio) per bin and the bin relative distance from the centromere. On the horizontal axis, 0.0 represents the centromere and 1.0 represents the telomere. The curve and its equation best fitting the data are shown.

This Article

  1. Genome Res. 13: 753-763

Preprint Server