
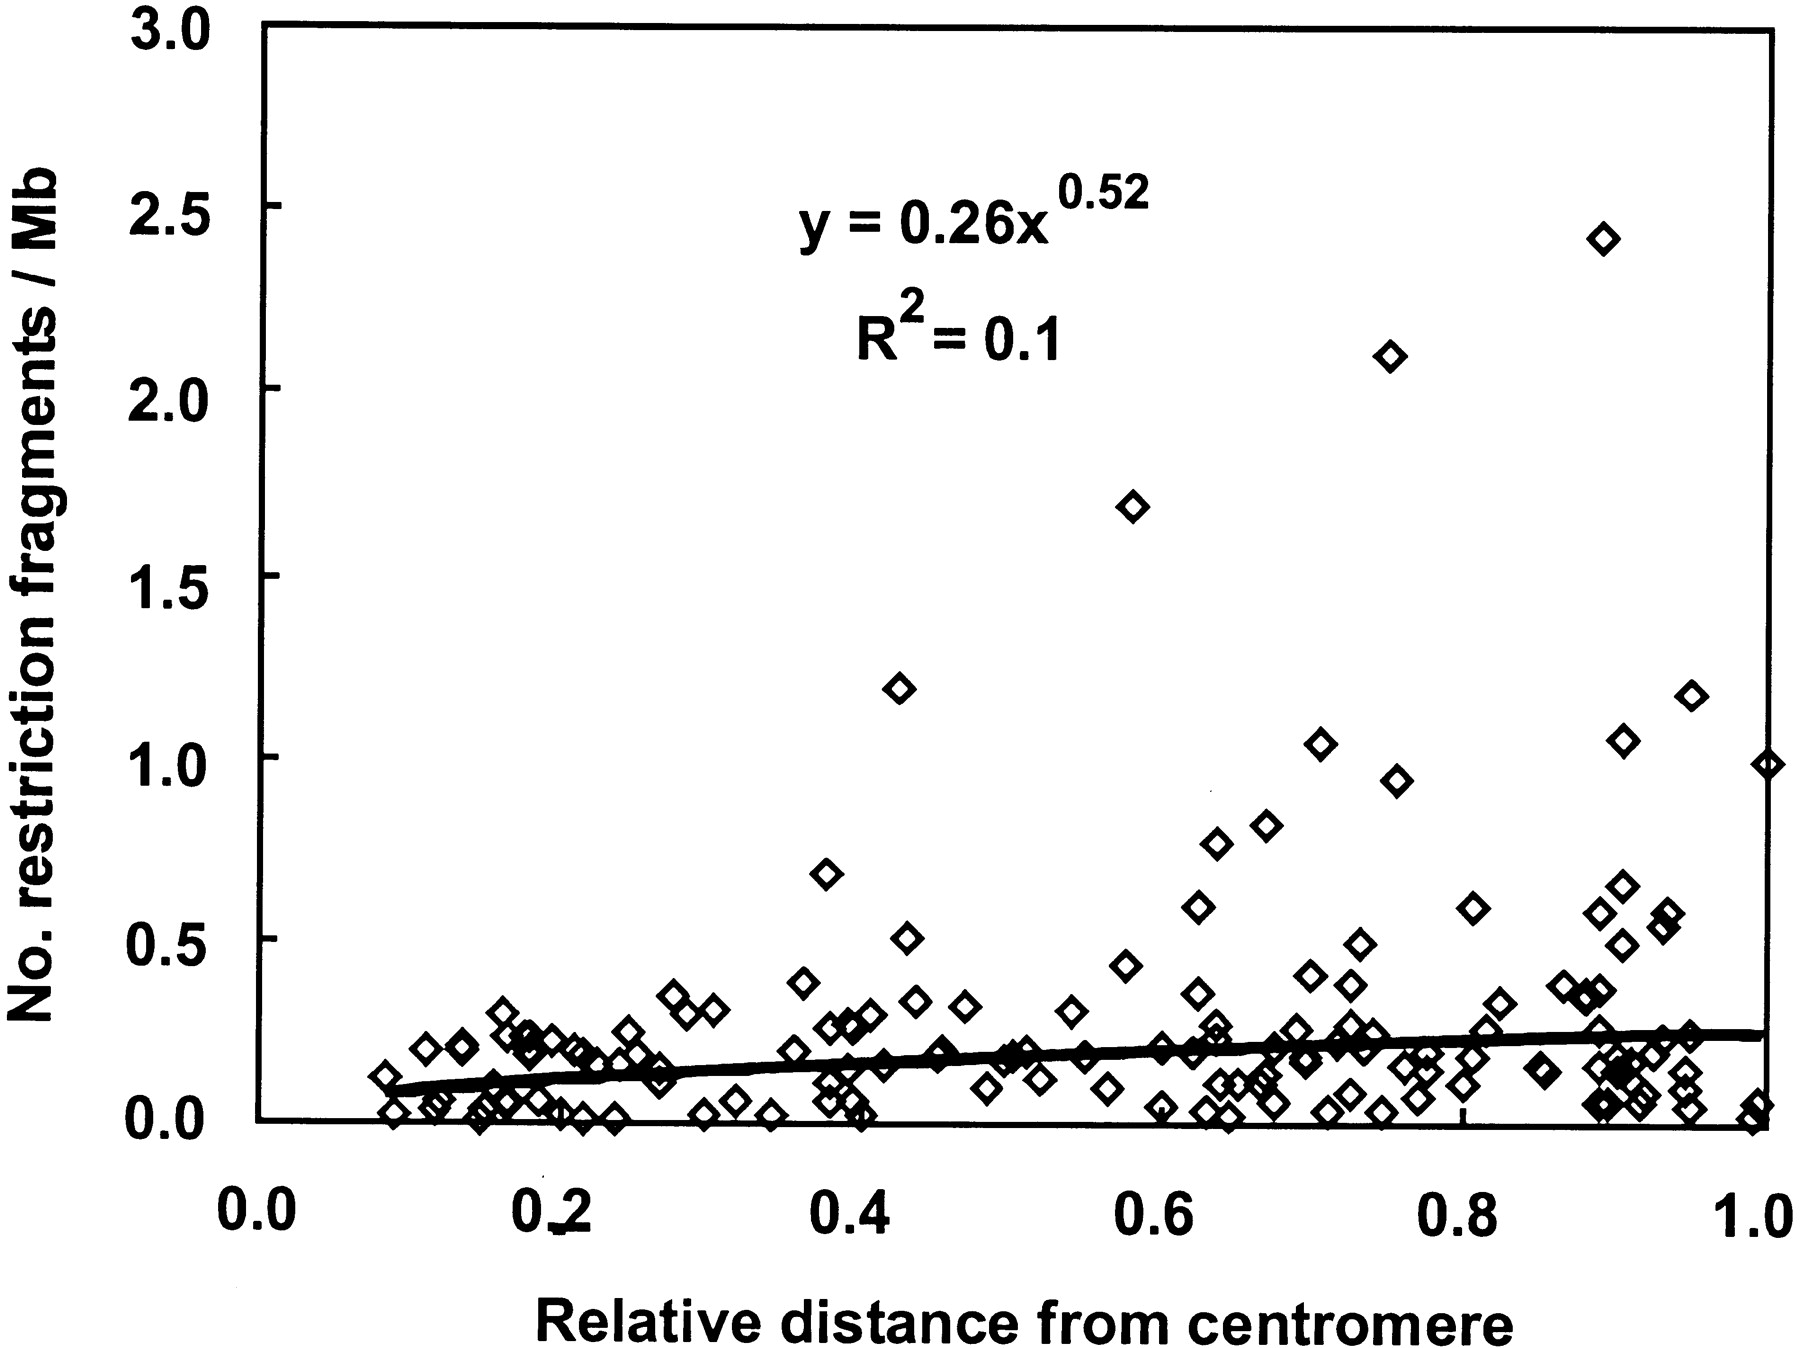
Figure 2.
Relative gene density along chromosome arms. On the horizontal axis, 0.0 represents the centromere and 1.0 represents the telomere. Relative gene density is estimated by the number of restriction fragments per Mb. The curve and its equation best fitting the data are shown.


