
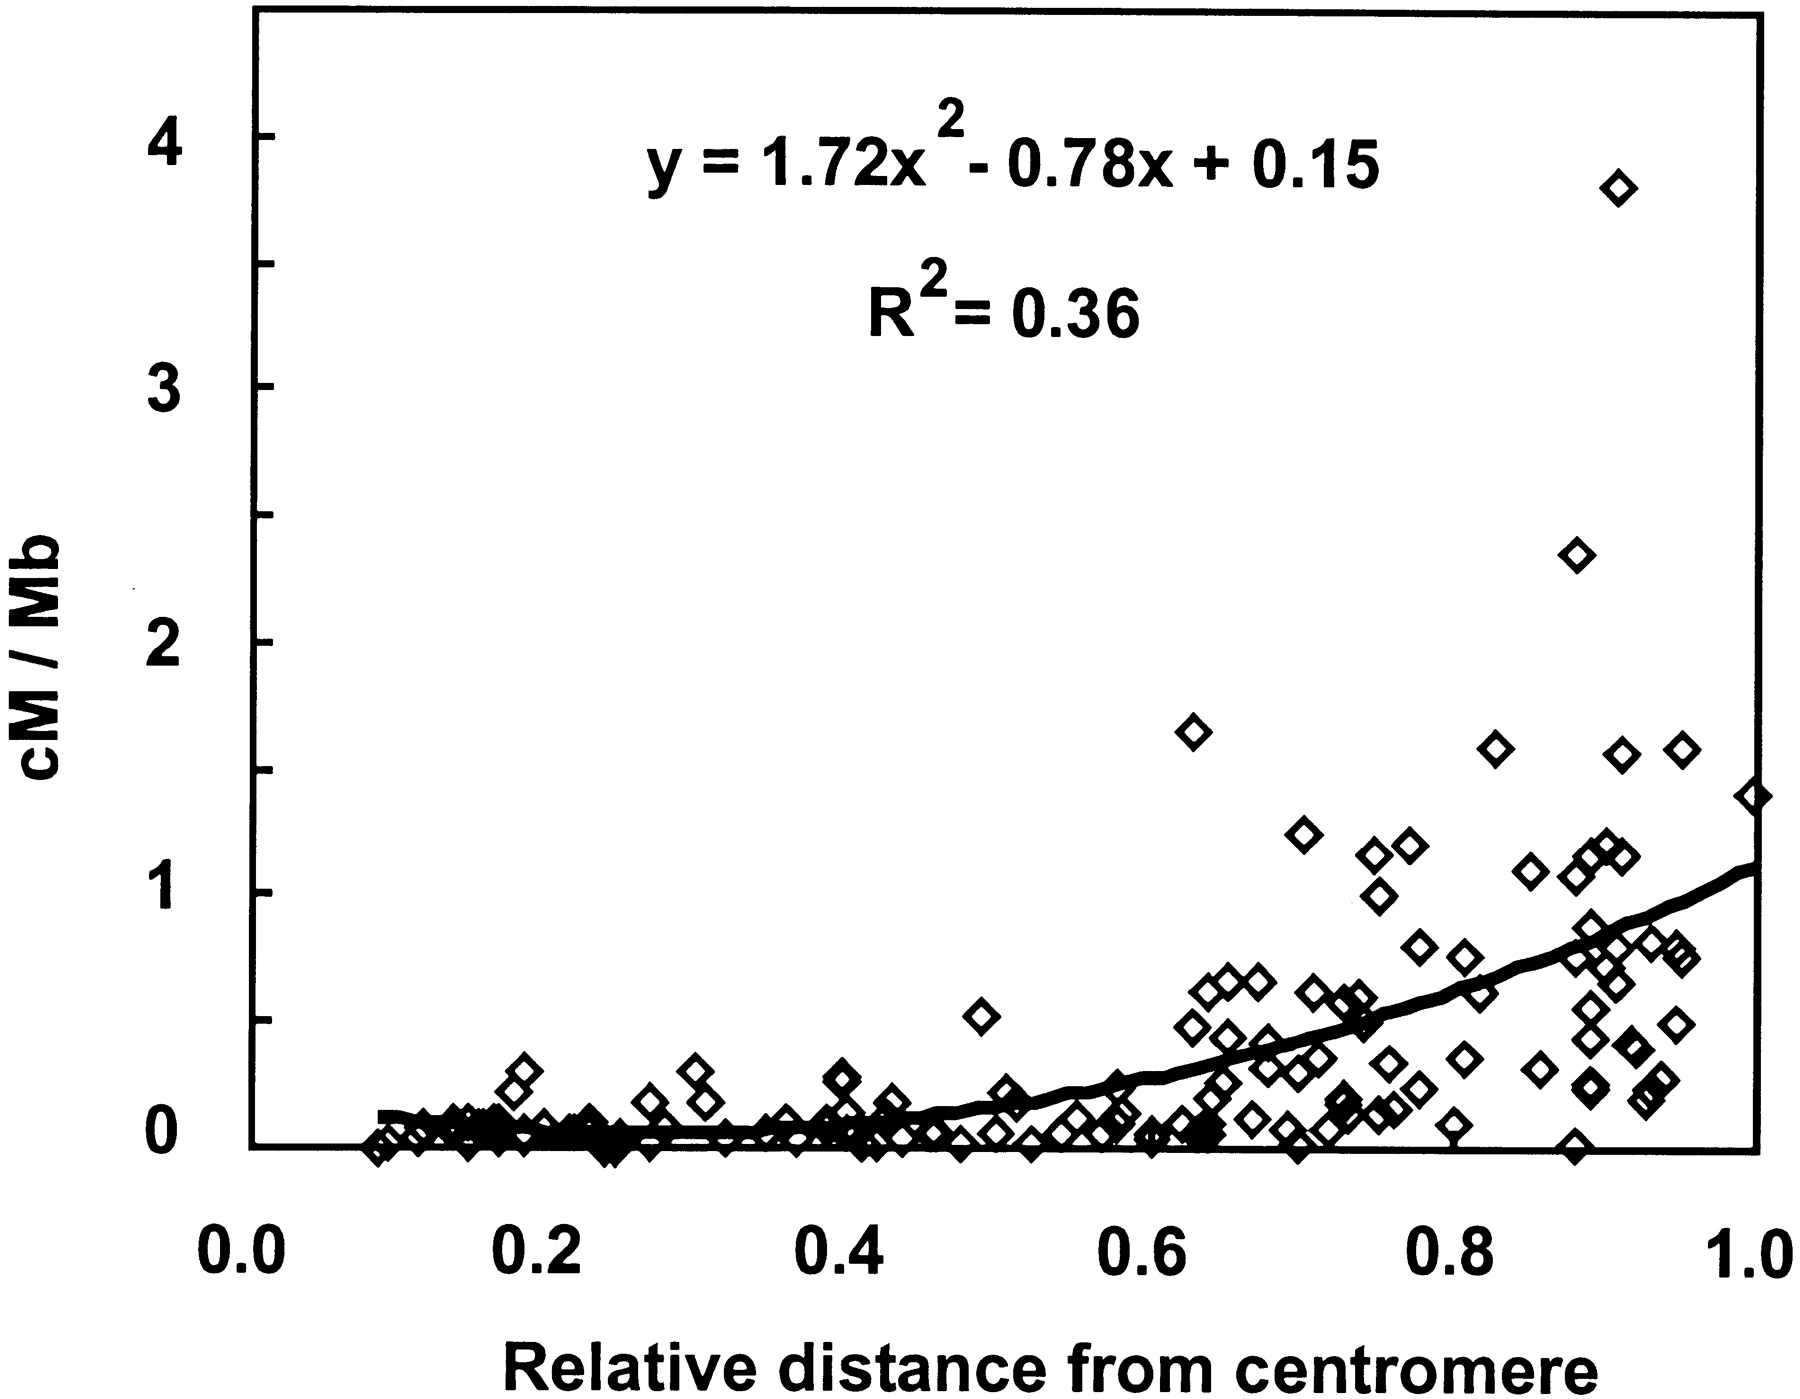
Figure 1.
Estimates of recombination rates (cM/Mb) within individual bins in relation to the position of bin midpoints on the centromere-telomere axis of wheat chromosome arms. On the horizontal axis, 0.0 represents the centromere and 1.0 represents the telomere. The curve and its equation best fitting the data are shown.


