
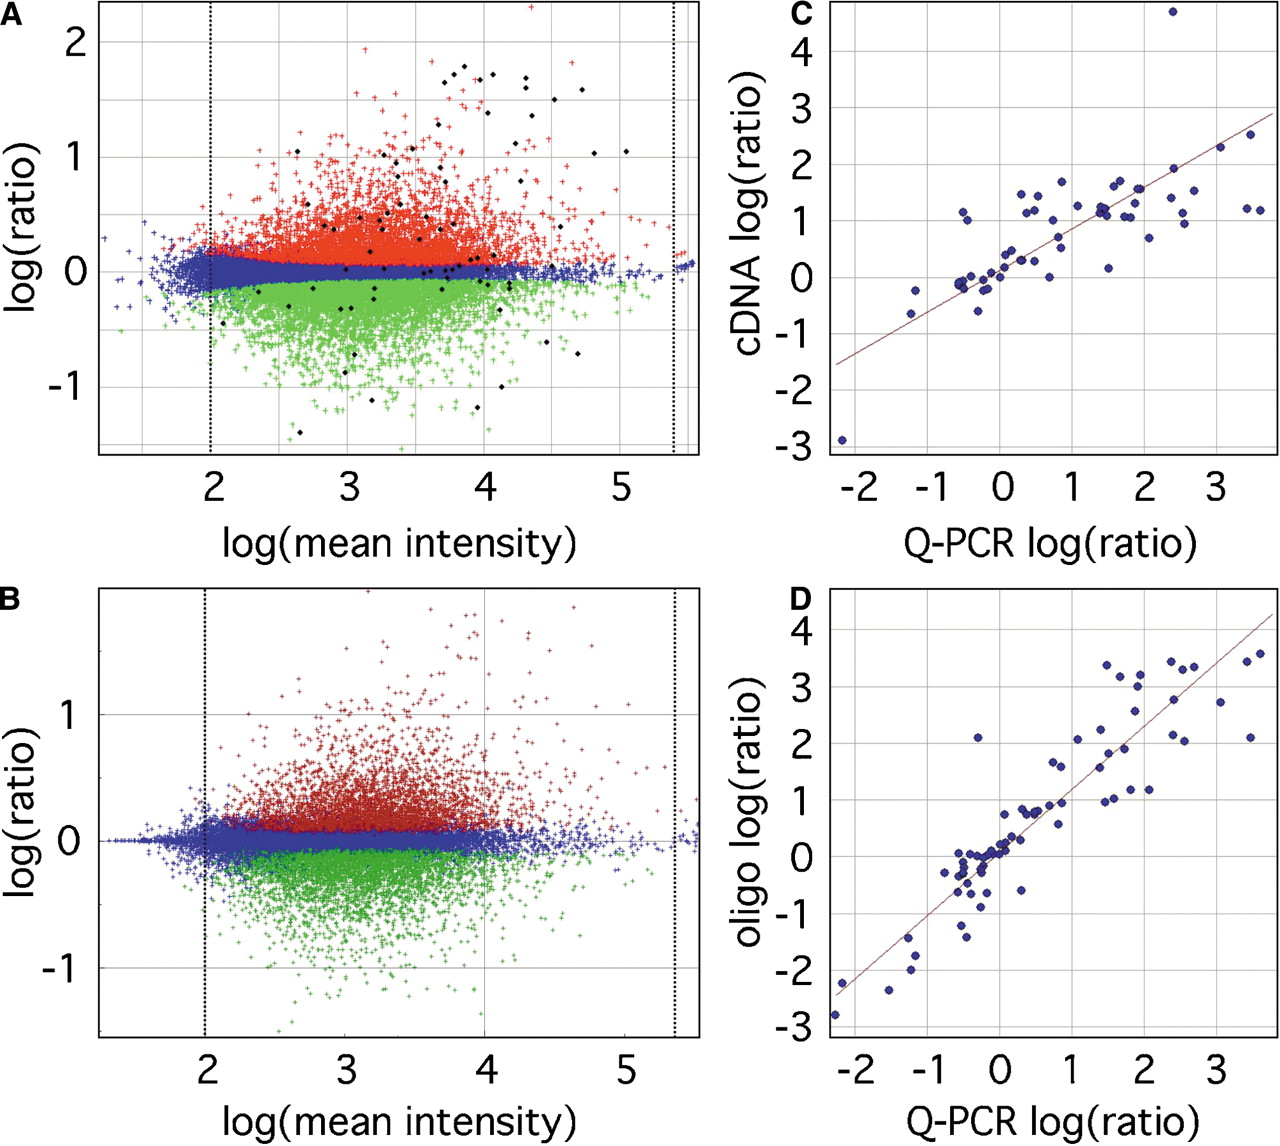
Differential gene set identification and Q-PCR validation. (A) ANOVA-FDR analysis of oligo microarrays identified a set of 9389 transcripts significant at FDR < 0.05, with 4406 upregulated and 4983 downregulated in placenta, indicated by red and green points, respectively. Blue points indicate nonsignificant probes. Average log(mean intensity) values below 2.0 or greater than 5.4, indicated by the dotted lines, were discarded. (B) Analysis of the same data set using Resolver 3.0 software identified a similar set of transcripts (12,247 total, 6136 upregulated and 6111 downregulated in placenta) containing 96.9% of the transcripts identified inA. A set of 71 transcripts, indicated by the black points inA, was chosen as a representative sample for validation by Q-PCR, and log(ratio) values were compared against those from cDNA arrays for 56 transcripts held in common (C), for a correlation coefficient of 0.74 and slope of 0.60. (D) Q-PCR results more closely matched oligo microarray results (using data from all 71 Q-PCR transcripts), with a correlation coefficient and slope of 0.91 and 0.55, respectively. See Supplemental Table 1 for a complete listing of data used in microarray/Q-PCR comparisons.


