
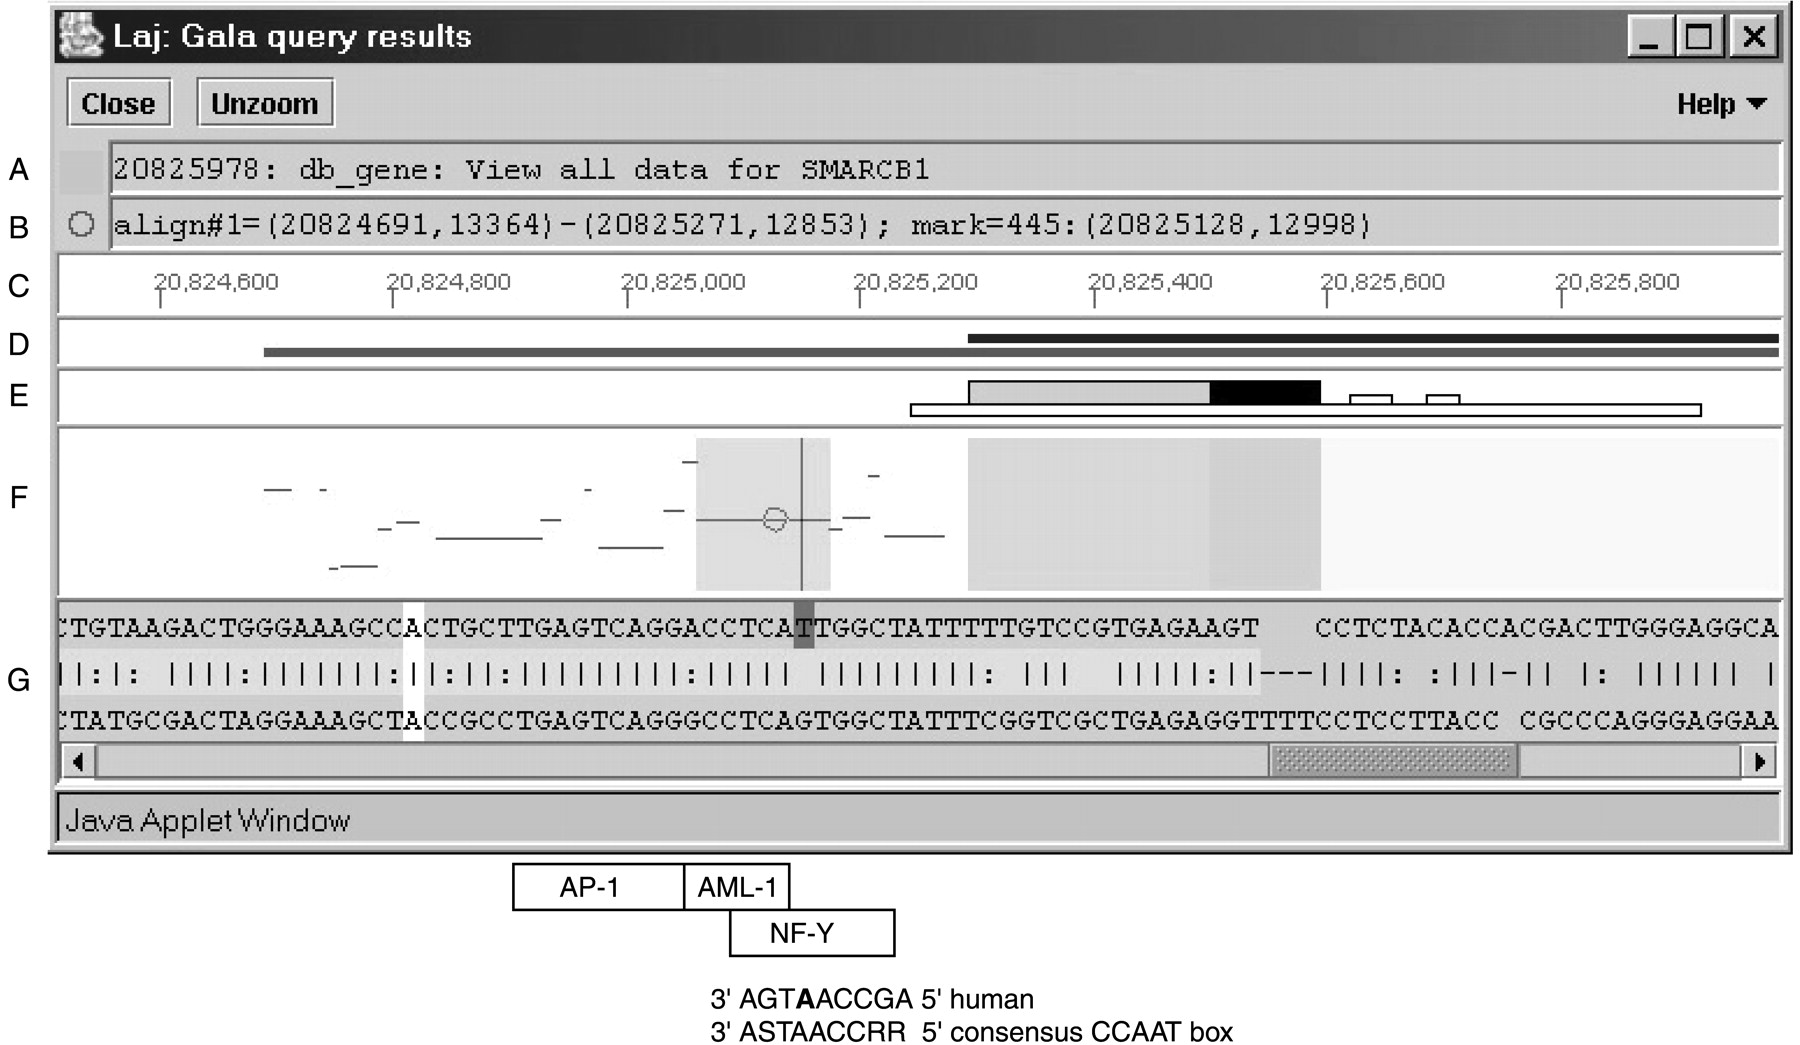
Sample output from GALA visualized in the Laj viewer, a Java applet for viewing alignment results. The figure shows a display window with panels for (A) the position of the mouse pointer and identification of any objects at that location, (B) the position of the moveable circle, (C) Human Genome Browser (HGB) coordinates for the region and (D) hyperlinks to alignment information (gray) and data for genes (black). (E) Icons for genomic features including locations of coding exons (dark-filled taller box), untranslated regions (UTRs) (gray-filled taller box), CpG islands (long, low open box), and simple repeats (short, low open boxes), as well as interspersed repeats when present. (F) The percent identity plot of the alignments in the query results showing the positions of the aligning segments in human on the horizontal axis and percent identity of each gap-free segment on the vertical axis. Important features are highlighted with underlays, including coding exons, UTRs, introns, highly conserved noncoding regions (at least 100 bp gap-free and at least 70% identity), and the single nucleotide polymorphisms (SNP). (G) The nucleotide-level alignment for the local alignment marked by the circle in F. The polymorphic nucleotide is a T (dark gray) in the reference human sequence. Boxes for matches to transcription-factor binding sites in the vicinity of the SNP are drawn below the local alignments with Java (Laj) screen shot. For the CCAAT box (binding site for NF-Y), the sequence of the reverse complement of the human sequence is given, as well as the sequence of the consensus binding site. Note that the SNP (in boldface) is part of the consensus-binding site. Alignments that are shown in the percent identity plot (pip) include only the ones that were selected in the query. Thus, if a size threshold was applied, only alignments meeting it appear in the pip. Gray horizontal bars inD show the positions of all aligning segments. The nucleotide-level view is obtained by clicking on any alignment in the pip. Names of genes and information about repeats appear in the text box at the top of the page (A).


