
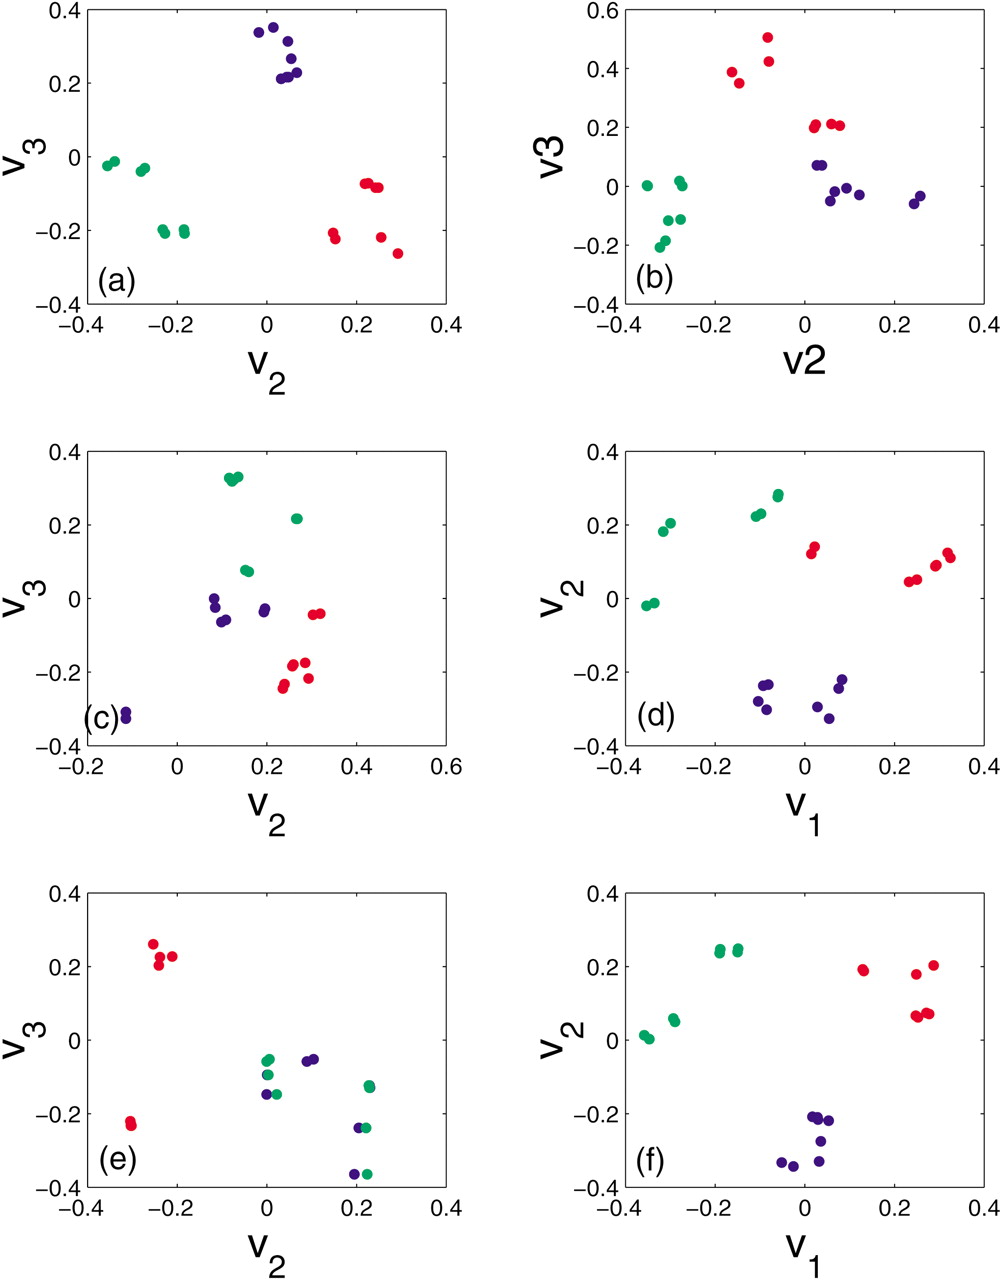
Breast cell lines transfected with the CSF1R oncogene: Scatter plots as in Fig. 3 for mRNA ratios of benign breast cells and wild-type cells transfected with the CSF1R oncogene causing them to invade and metastasize (red), ratios of cells transfected with a mutated oncogene causing an invasive phenotype and cells transfected with the wild-type oncogene (blue), and ratios of cells transfected with a mutated oncogene causing a metastatic phenotype and cells transfected with the wild-type oncogene (green). In this case we preselected differentially expressed genes such that for at least one pair of samples, the genes had a twofold ratio.


