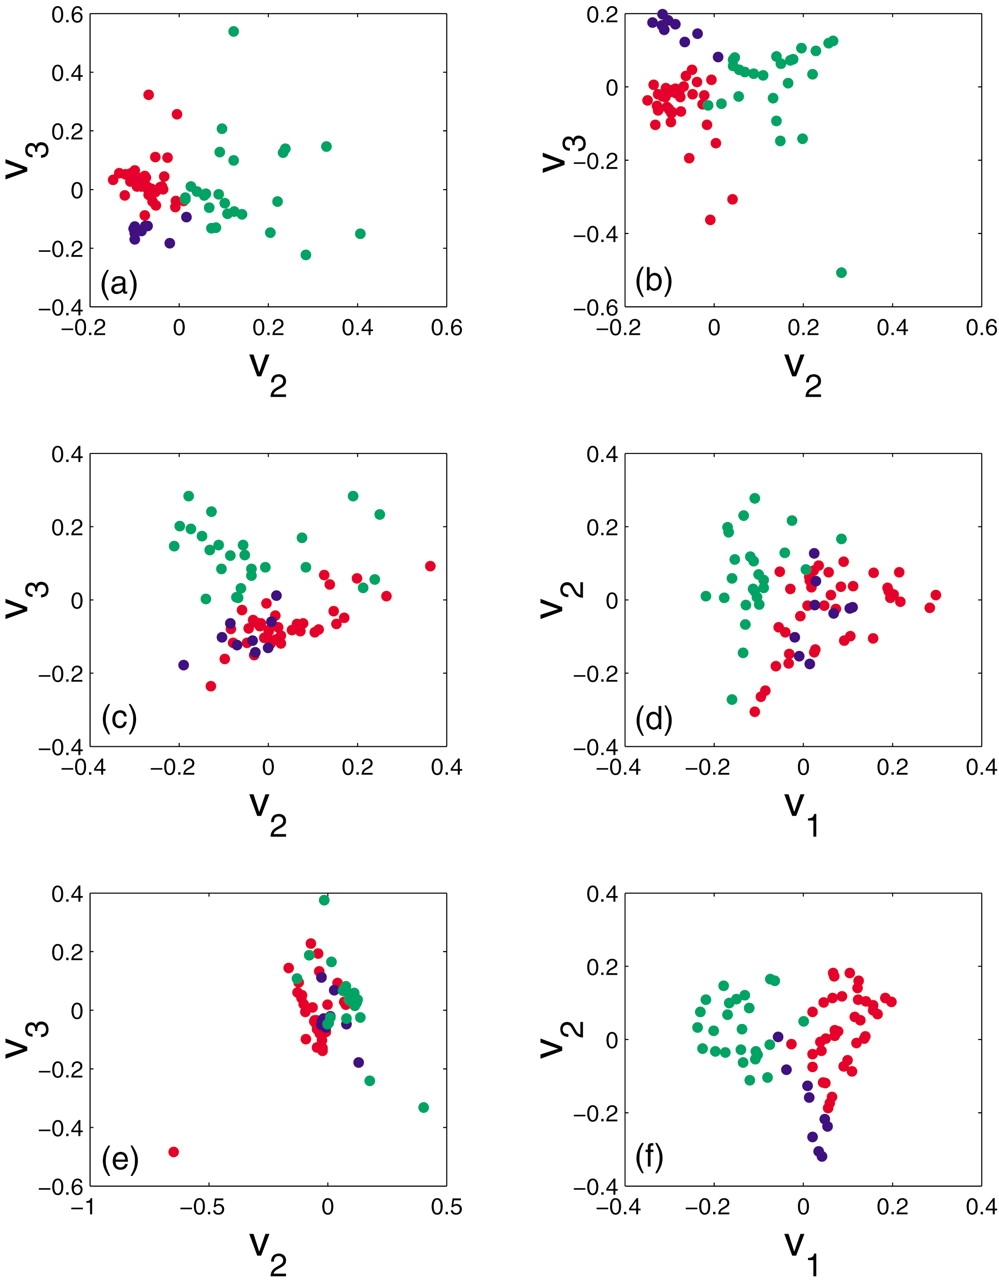
Spectral Biclustering of Microarray Data: Coclustering Genes and Conditions

(Downloading may take up to 30 seconds. If the slide opens in your browser, select File -> Save As to save it.)

Click on image to view larger version.

Figure 5.
Figure 5.

Leukemia data presented in the same format as in Fig. 3. B-cell ALL samples are denoted by red dots, T-cell ALL by blue dots, and AML by green dots. In this analysis we preselected all genes that had positive Affymetrix average difference expression levels.

This Article

  1. Genome Res. 13: 703-716

Preprint Server