
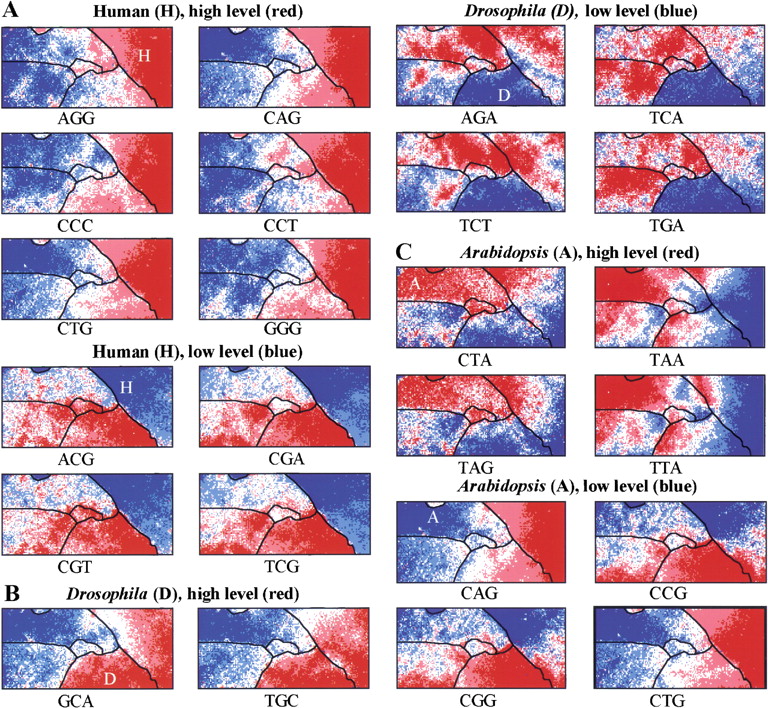
Figure 6.
Trinucleotide distribution in 10-kb tri-SOM for six eukaryotes. Levels of each trinucleotide for all lattice vectors in the tri-SOM of Fig. 4B were divided into five categories and shown as described in Fig. 3F. Species borders are shown as described in Fig. 5. (A) Human. Six diagnostic trinucleotides with high frequencies and four with low frequencies. (B) D. melanogaster. Two diagnostic trinucleotides with high frequencies and four with low frequencies. (C) A. thaliana. Four diagnostic trinucleotides with high frequencies and four with low frequencies (CNG).


