
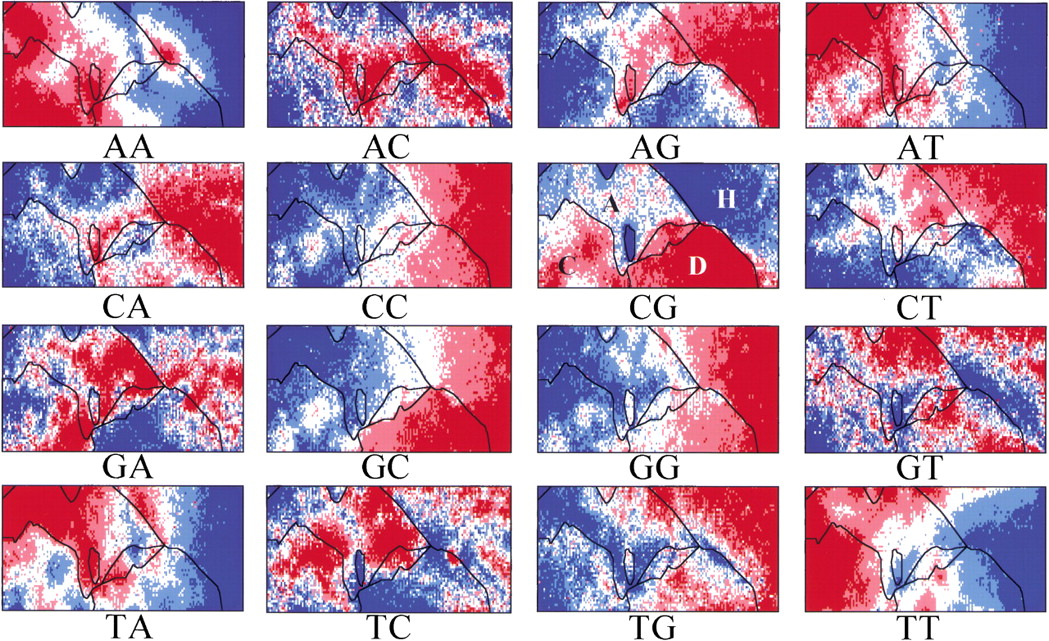
Figure 5.
Dinucleotide distribution in 10-kb di-SOM for six eukaryotes. Levels of each dinucleotide for all lattice vectors in the di-SOM of Fig. 4A were divided into five categories containing an equal number of lattices and the categories are shown as described in Fig. 3F. Species borders in the di-SOM (Fig. 4A) are marked by lines. Major zones for four species were noted in the CG panel as follows: A. thaliana (A),C. elegans (C), D. melanogaster (D), and human (H).


