
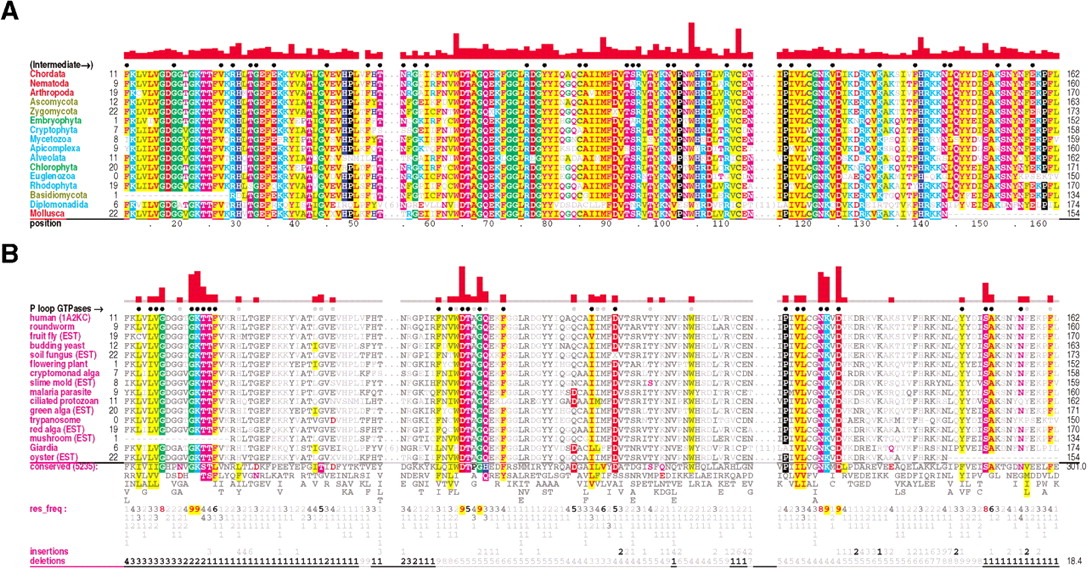
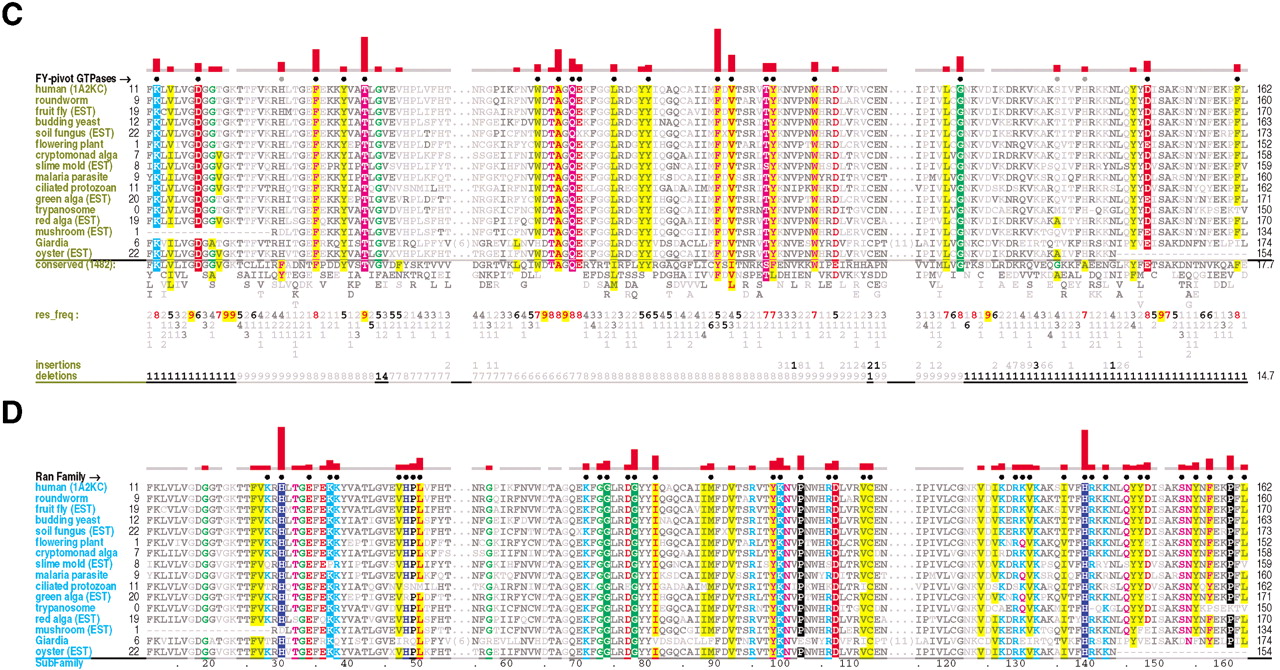
Ran family alignments generated by CHAIN analysis procedures. (A) Conventional multiple alignment. The leftmostcolumn specifies each sequence's phylum; these are colored by major eukaryotic taxa as follows: metazoans, red; fungi, dark yellow; plants, green; protozoans, cyan. The top sequence is the query. The NCBI sequence identifiers are: 5453555, 17553976, 3113905, 6323324, 11067497, 1710007, 13812290, 4881271, 585782, 1172840, 15691764, 606985, 8593487, 14089387, 585780, and 14581093. (B–D) Contrast hierarchical alignment. CHAIN analysis applies three different sequence highlighting schemes to the Ran family alignment in A to reveal the selective constraints most characteristic of each of three hierarchical categories, which here correspond to P-loop GTPases in B; FY-pivot GTPases inC; and the Ran family in D. Organism descriptions (leftmost column) are colored by category as specified in Figure 2; sequences obtained from ESTs are indicated. Note that for theBasidiomycota protein, which was predicted from an EST, the replacement of histidine (H) at position 30 by aspartate (D) is likely due to a sequencing error. Chemically similar highlighted residues are colored similarly. Histograms above the alignments display the relative strength of the inferred selective constraint acting at each position within that category (quasi-logarithmic scaling is used; see Methods). This and other aspects of this representational scheme are explained in Figure 2. Dots below the histograms (and directly above the alignments) indicate those residues specifically assigned to each category. Gray dots in B and C indicate positions for which Ran deviates from the canonical residues for that category. Note that the conventional alignment in A helps identify residues associated with intermediate categories, which correspond to conserved positions in Ran that are inconsistently conserved within the three categories of this hierarchy. A few residue positions (such as T42Ran) are misclassified in this analysis due to alignment errors; these were detected and addressed in our analysis through structural studies and CHAIN analysis of related GTPases.


