
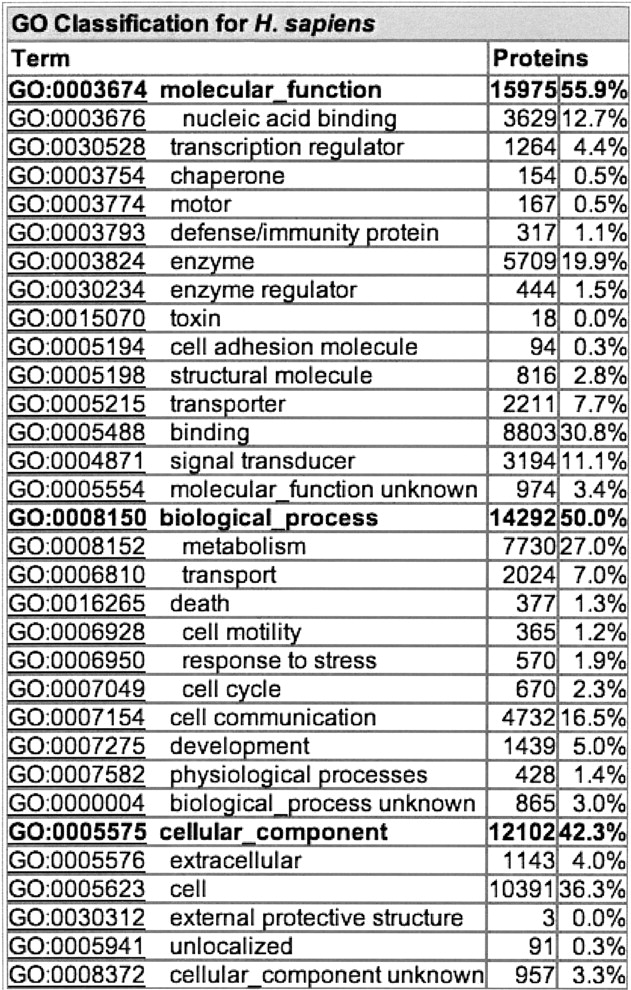
Figure 4.
Example of a table from the proteome analysis database showing the general statistics for the number of proteins in the human proteome that can be assigned to a selection of high-level terms (GO Slim) from each of the three gene ontologies.


