
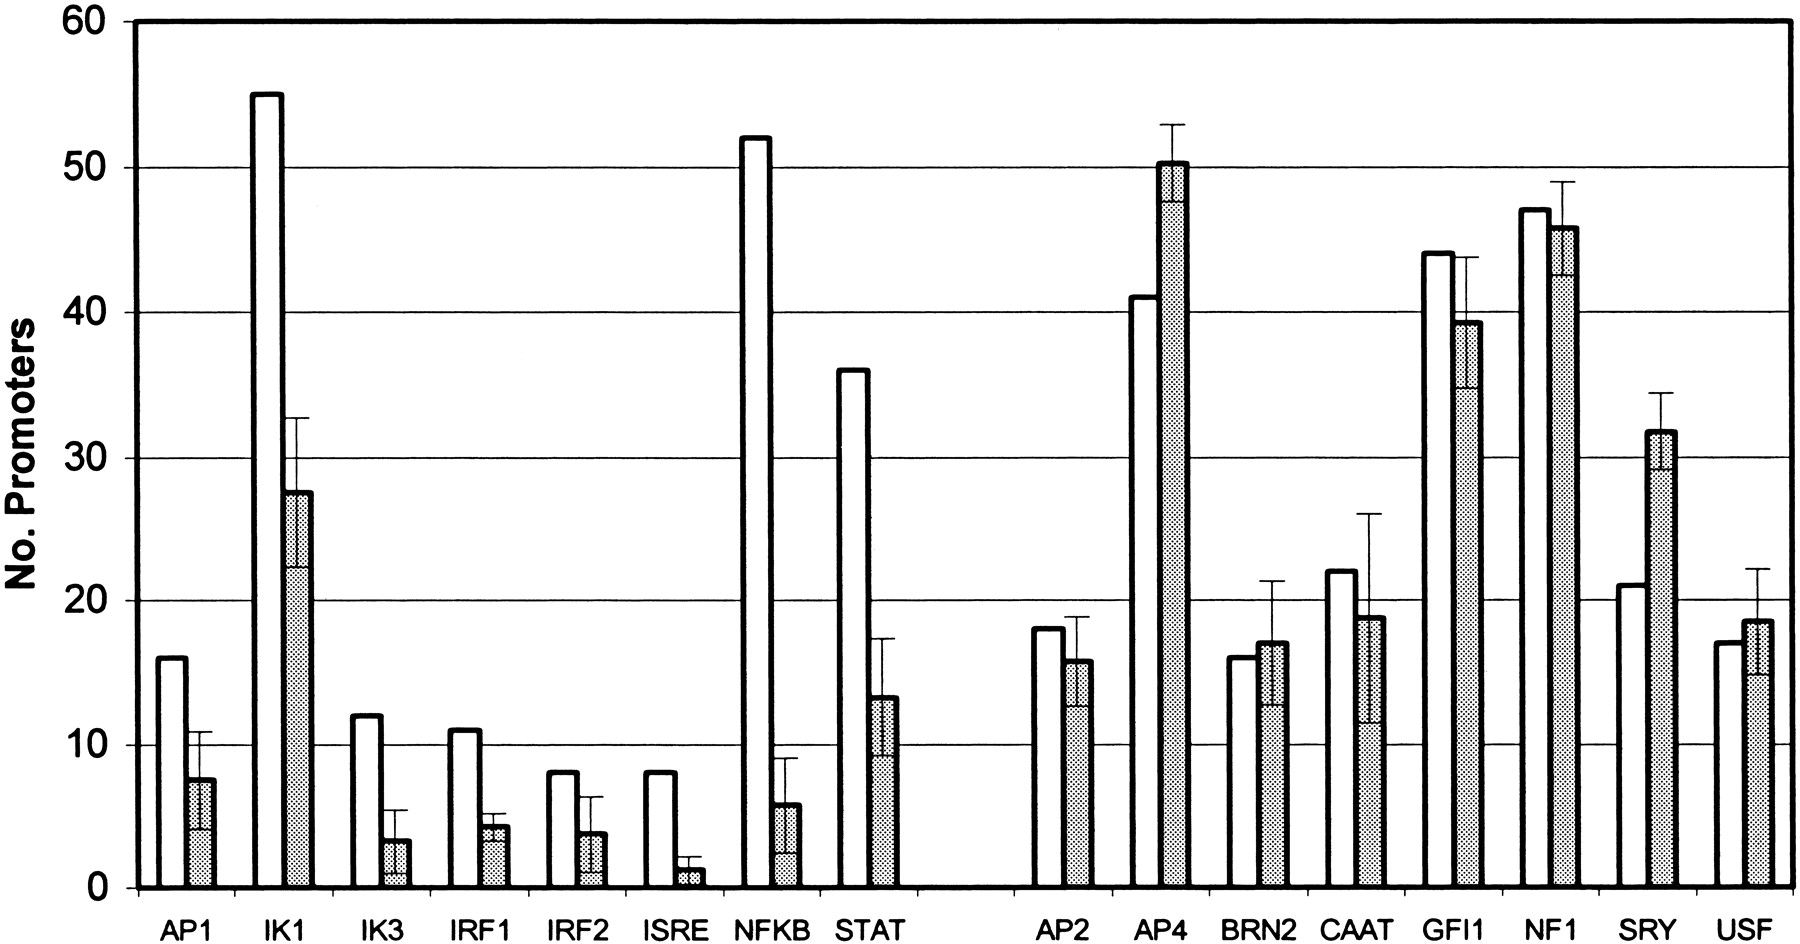
Abundance of transcription factor binding sites. Comparisons are made between the 62 NF-κB-regulated promoters and four sets of 62 mammalian nonimmune promoters from the EPD. The y-axis is the number of promoters with at least one binding site for the transcription factor. The white bar is the number of NF-κB-regulated immune gene promoters with the TF, and the gray bar is the mean count of promoters with the TF in the four sets of nonimmune promoters. The error bars represent one standard deviation in the nonimmune promoter data. Note that among the 62 NF-κB-regulated promoters, the number of promoters with NF-κB sites is 53, instead of 62. In this analysis, we set a high PWM threshold for detecting NF-κB binding sites (0.9), and thus we did not detect variant sites.


