
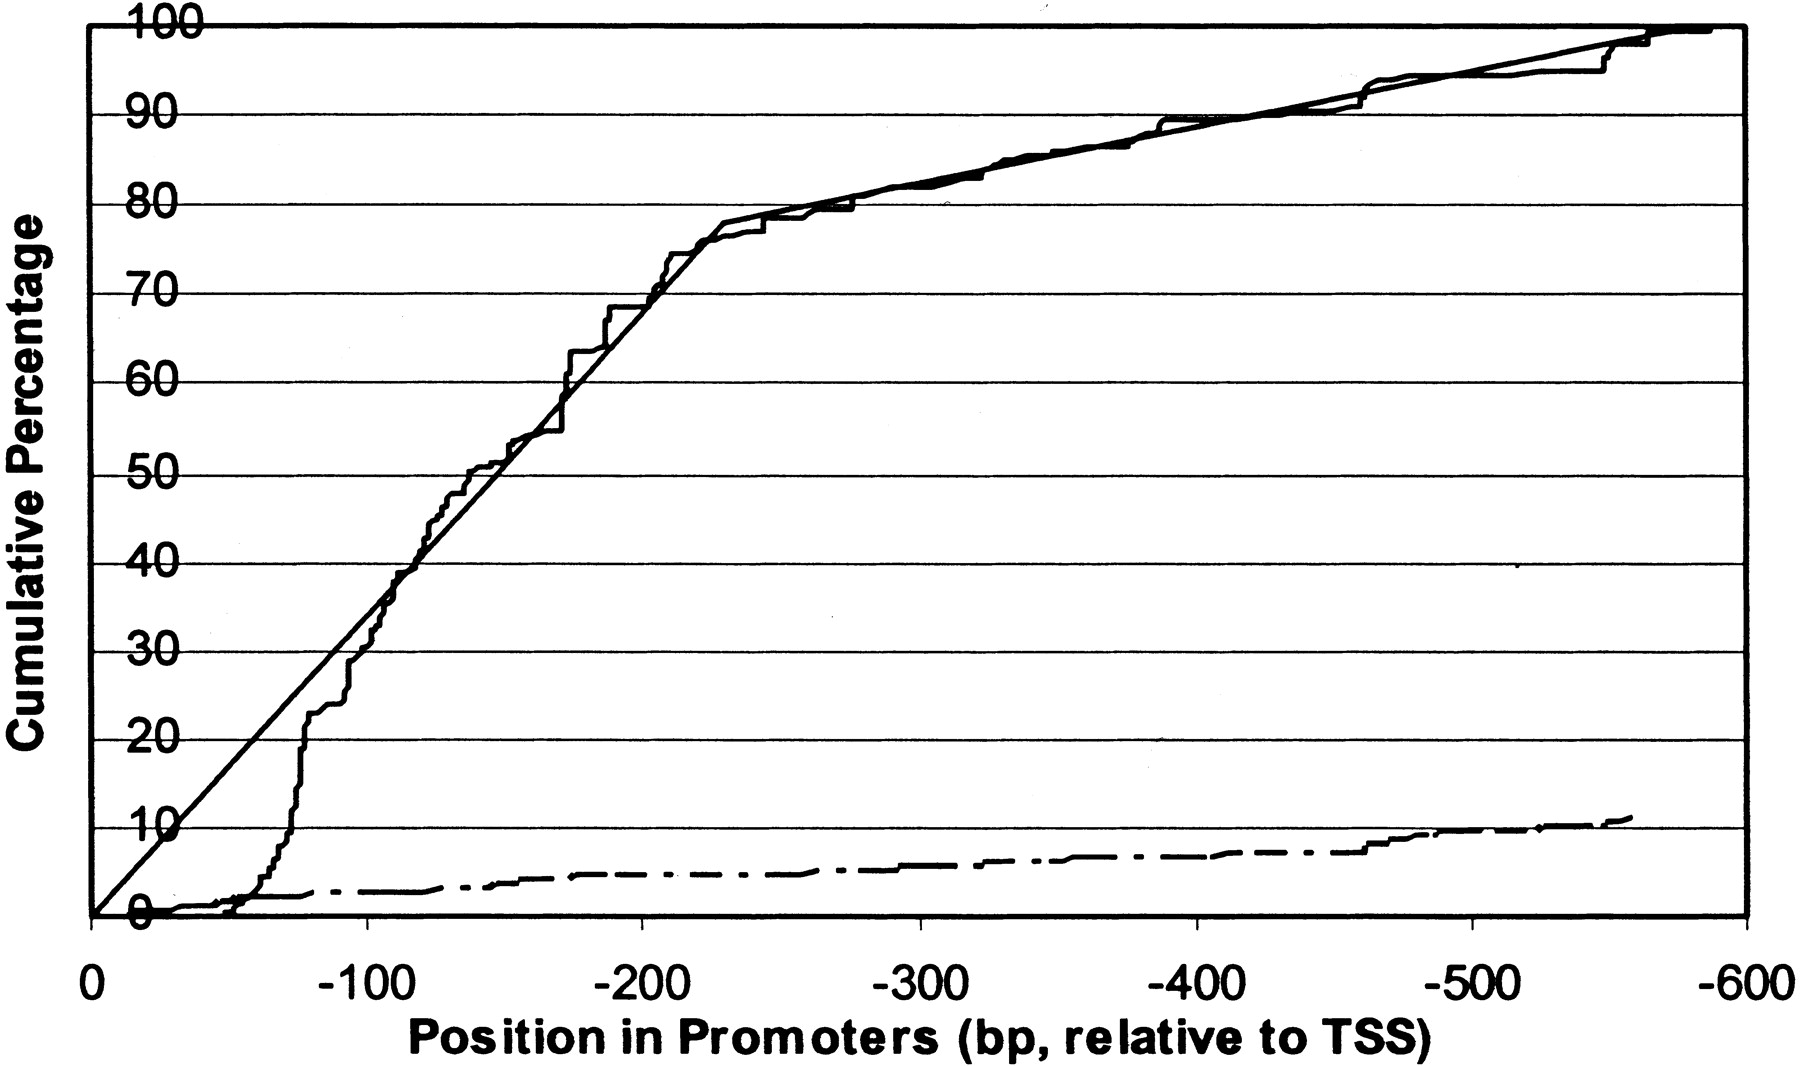
Position distribution of NF-κB binding sites. The x-axis is the position of NF-κB binding sites relative to the transcription start site. The y-axis is the cumulative percentage of NF-κB binding sites. The upper (solid) curve is for NF-κB sites in immune promoters, and the lower (dotted) curve is for NF-κB sites in nonimmune promoters (percentage relative to total NF-κB binding sites in the 62 immune promoters). The upper curve has roughly two phases; one is between −1 and −230 bp, and the other is from −231 to −600 bp. The turning point is revealed by piecewise linear regression (solid lines). Over 75% of NF-κB sites are within the 230-bp region immediately upstream of TSS. From the dotted curve, it appears that NF-κB sites in nonimmune promoters do not have positional preference.


