
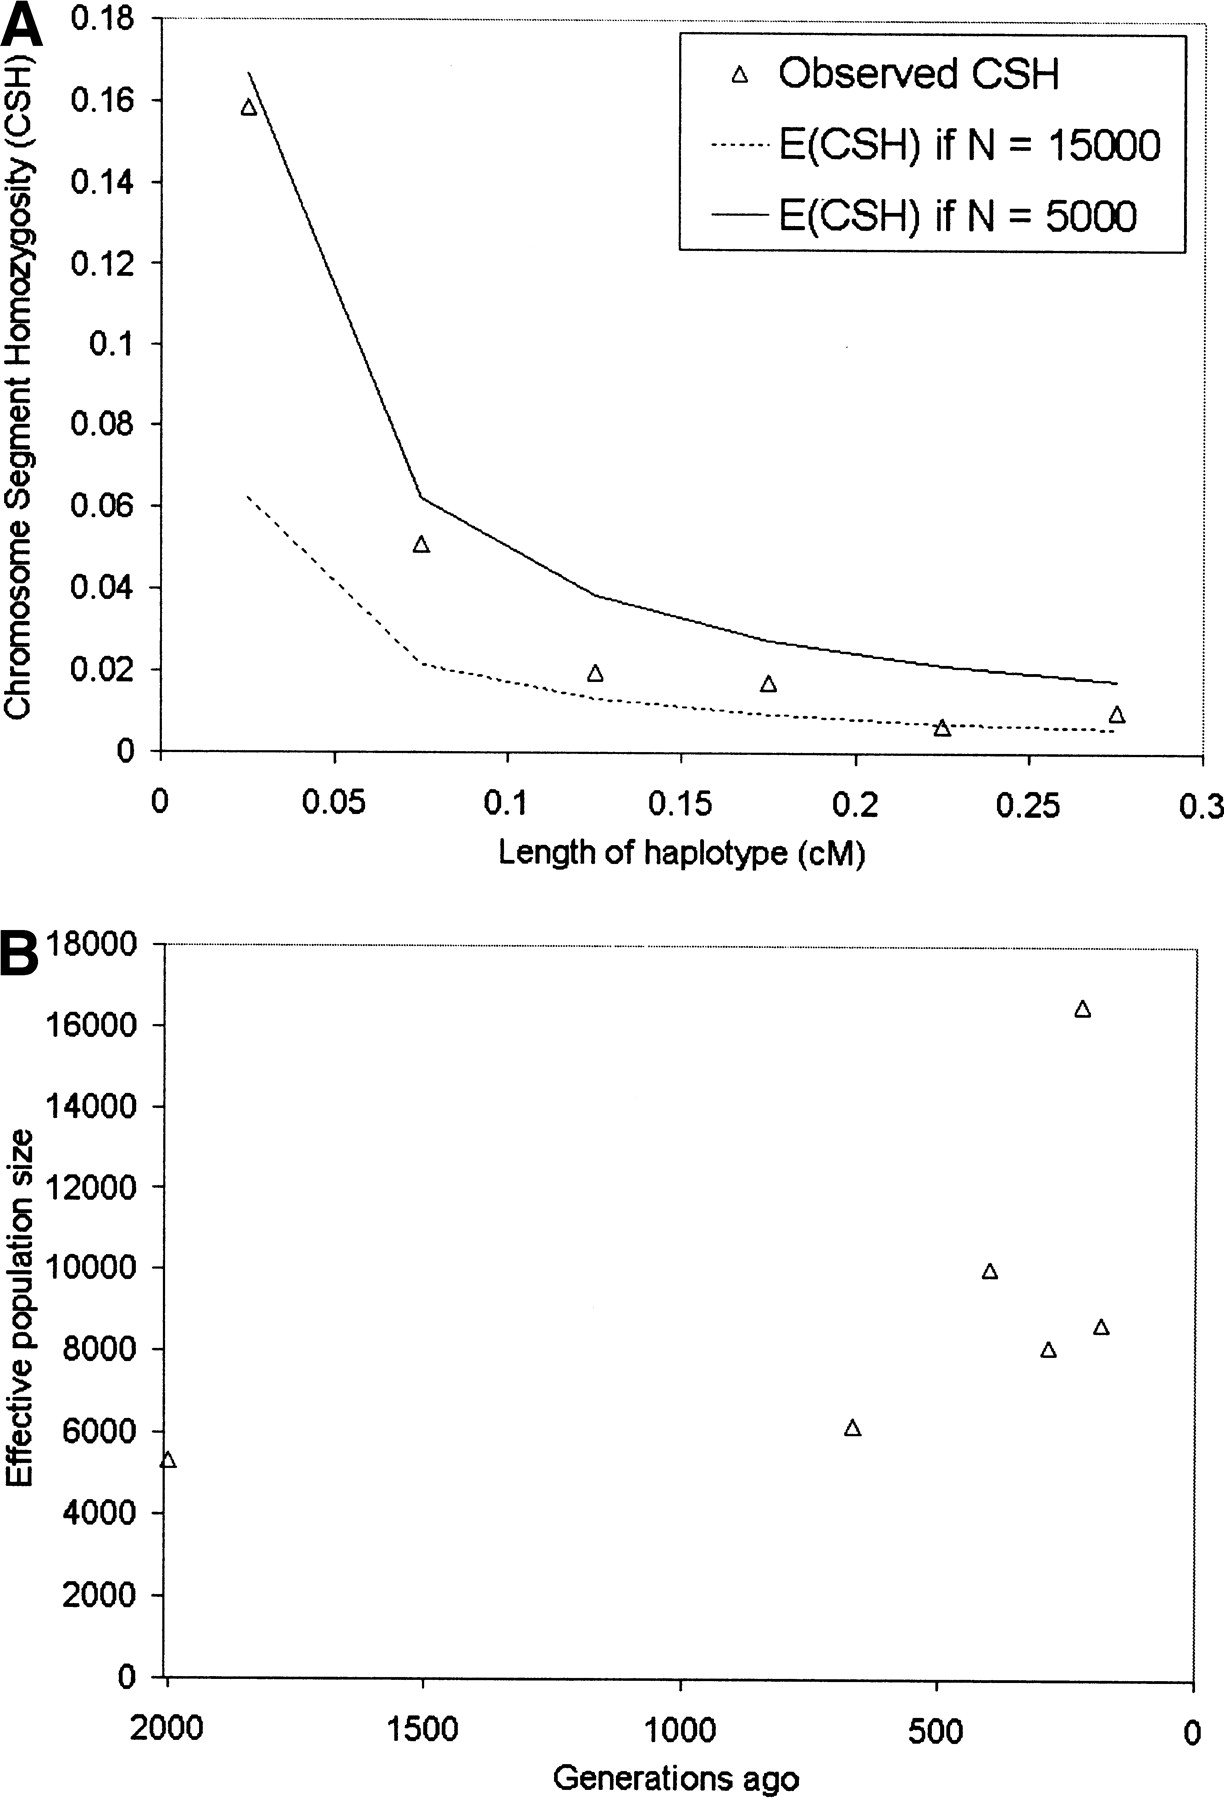
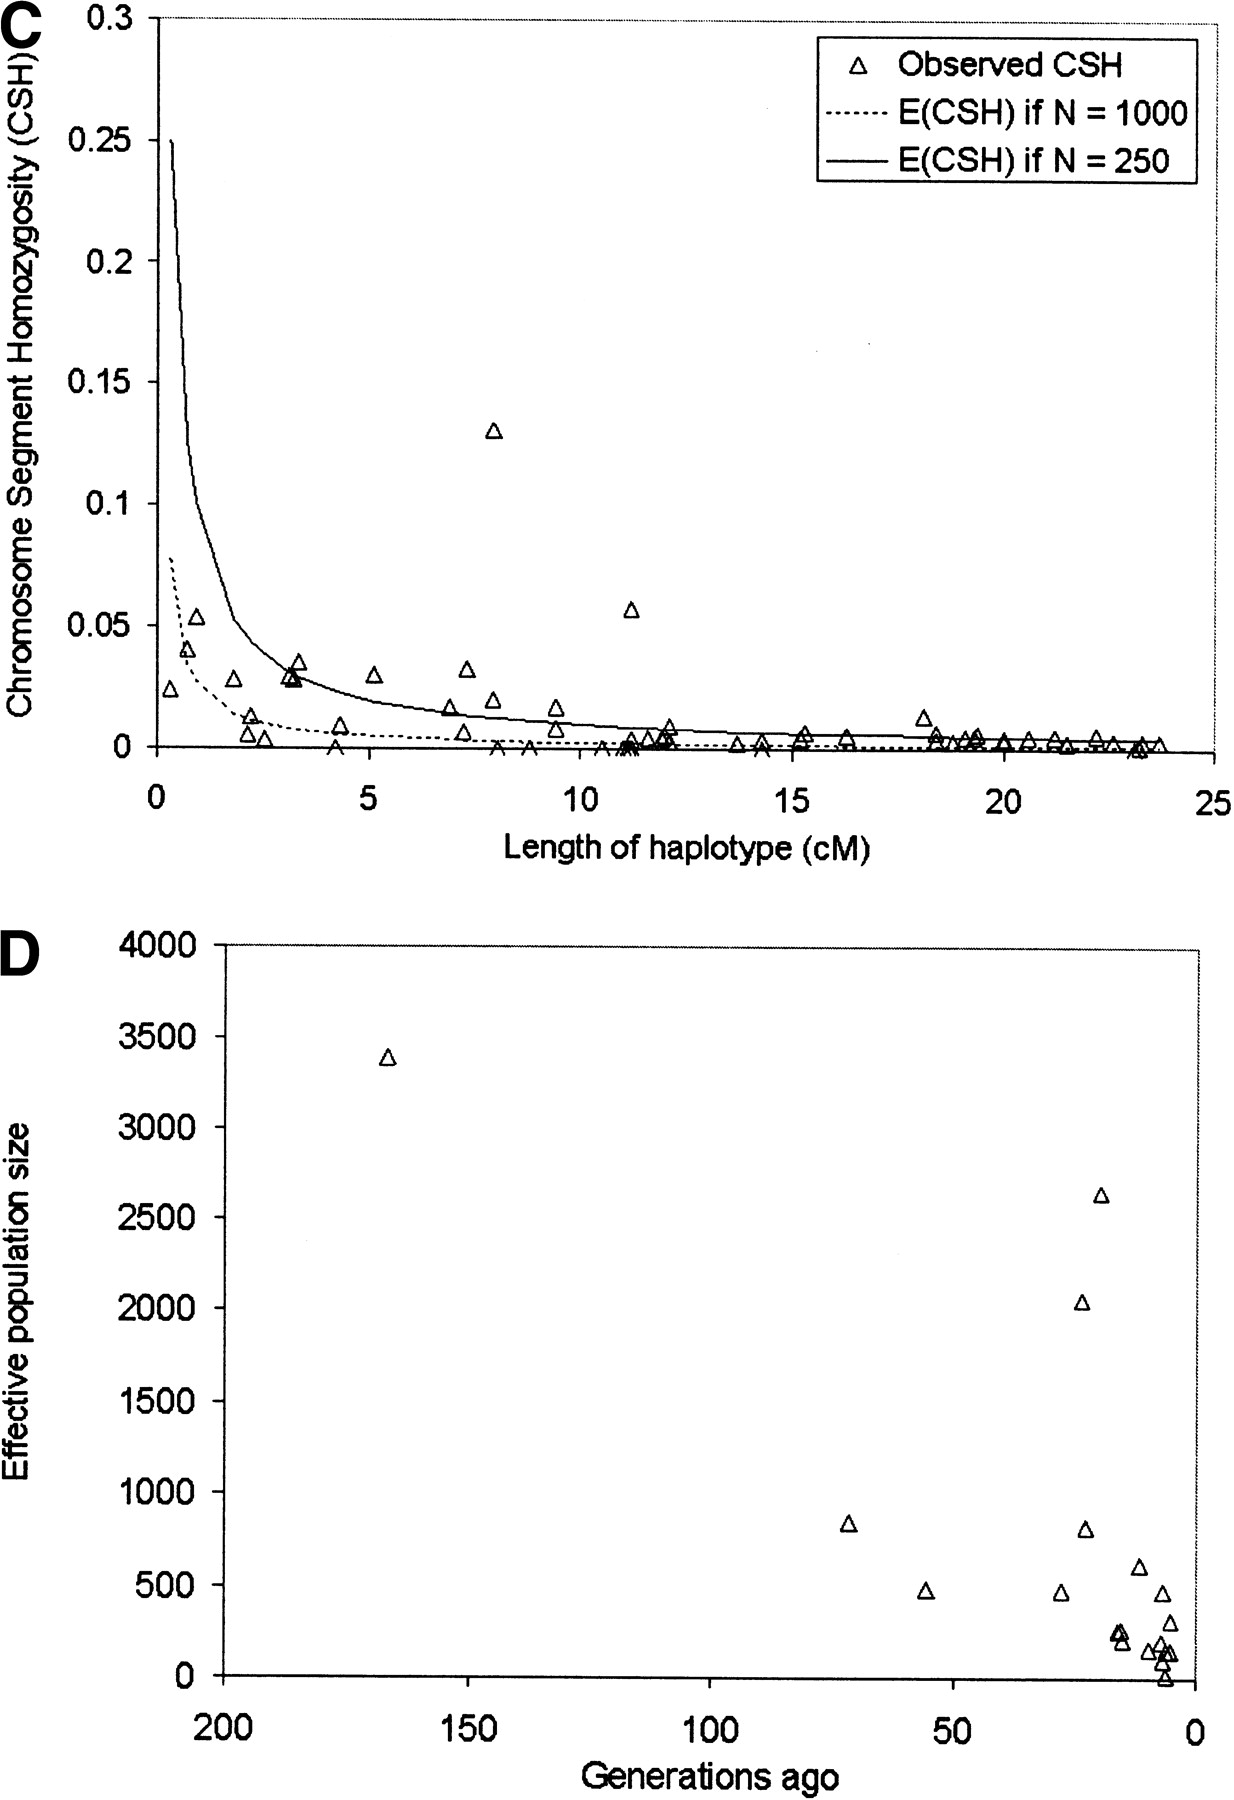
Figure 4.
(A) Chromosomal homozygosity for increasing lengths of haplotype from the data of Moffat et al. (2000). The upper (solid) line is the expected CSH when the effective population size is 5000. The lower (dashed) line is the expected CSH when the effective population size is 15,000. (B) Effective population size of the human population ancestral to the sample used, up to 2000 generations ago. (C) Chromosomal homozygosity from the dairy cattle data set. Also plotted are the expected values of CSH when N = 1000 and N = 250. (D) Effective population size of the dairy cattle population ancestral to the sample used, up to 167 generations ago.


