
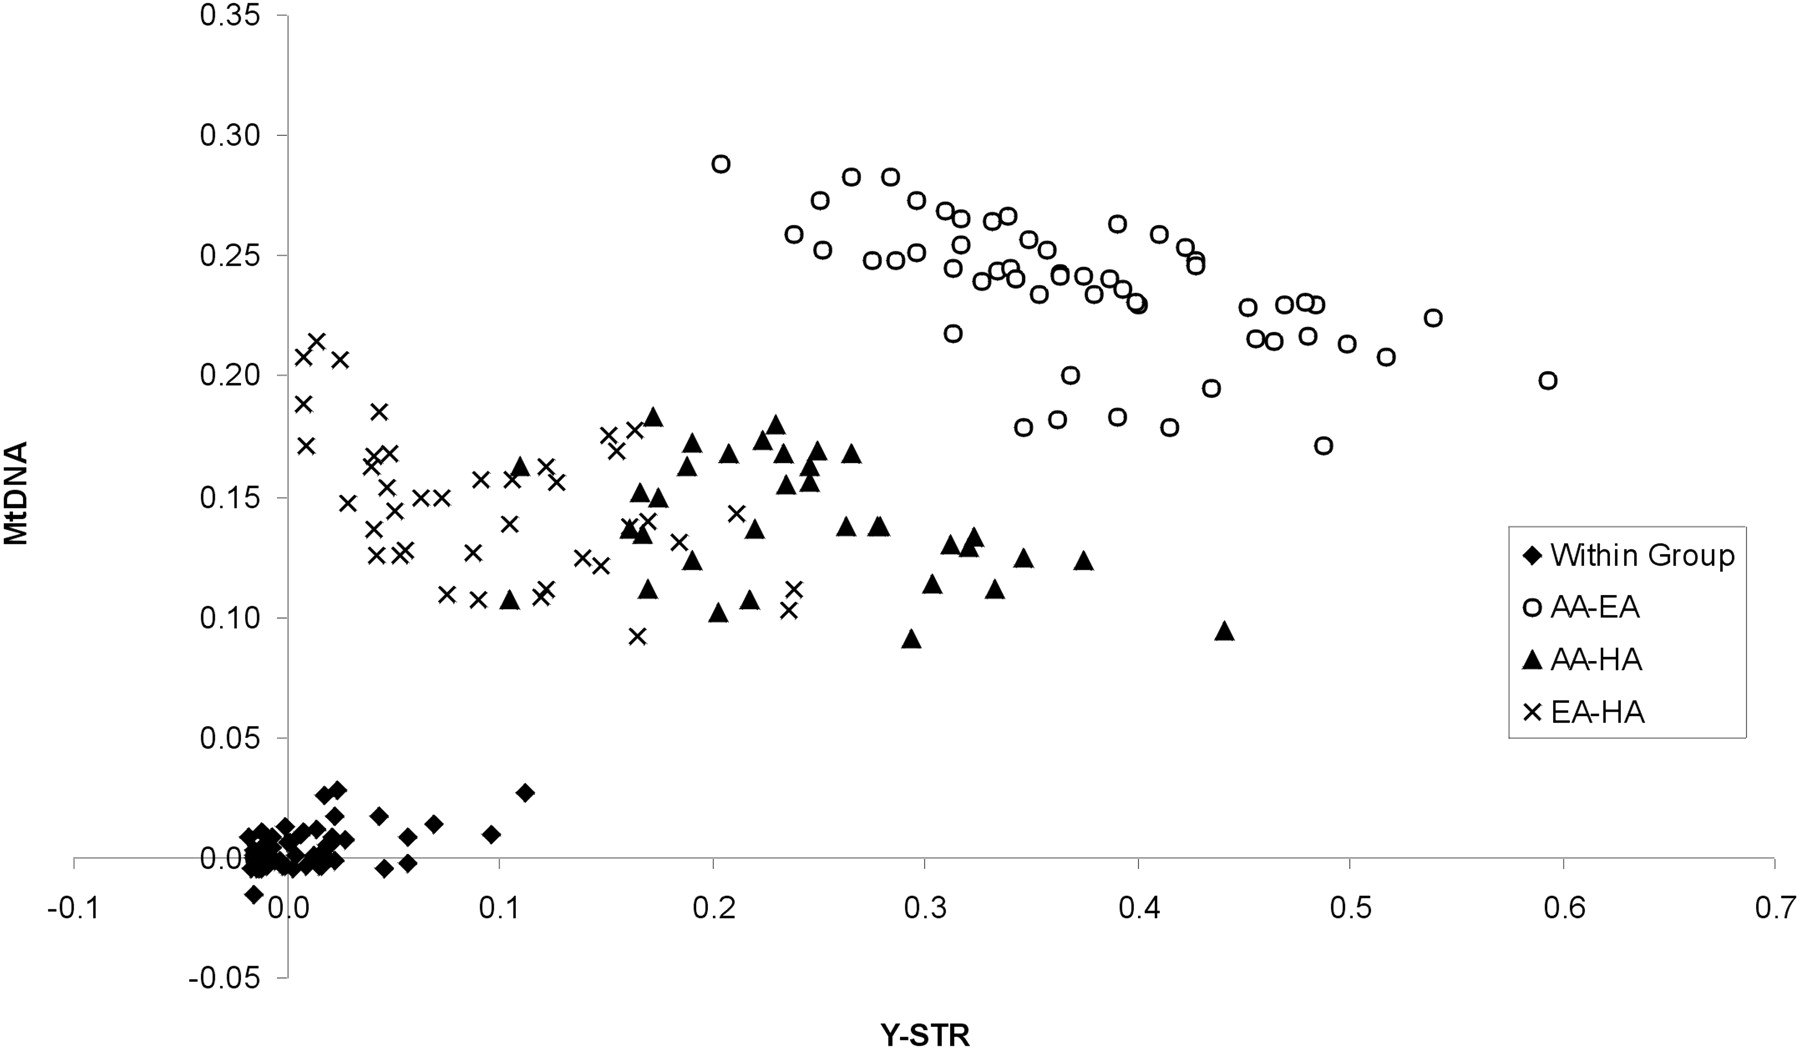
Figure 5.
Plot of RST values for Y-STR haplotypes vs. FSTvalues for mtDNA SSO-types, for U.S. groups. (AA) African-American; (EA) European-American; (HA) Hispanic.
(Downloading may take up to 30 seconds. If the slide opens in your browser, select File -> Save As to save it.)
Click on image to view larger version.
Plot of RST values for Y-STR haplotypes vs. FSTvalues for mtDNA SSO-types, for U.S. groups. (AA) African-American; (EA) European-American; (HA) Hispanic.
 CiteULike
 Delicious
 Digg
Digg Facebook
 Google+
 Reddit
 Twitter
