
Figure 2.
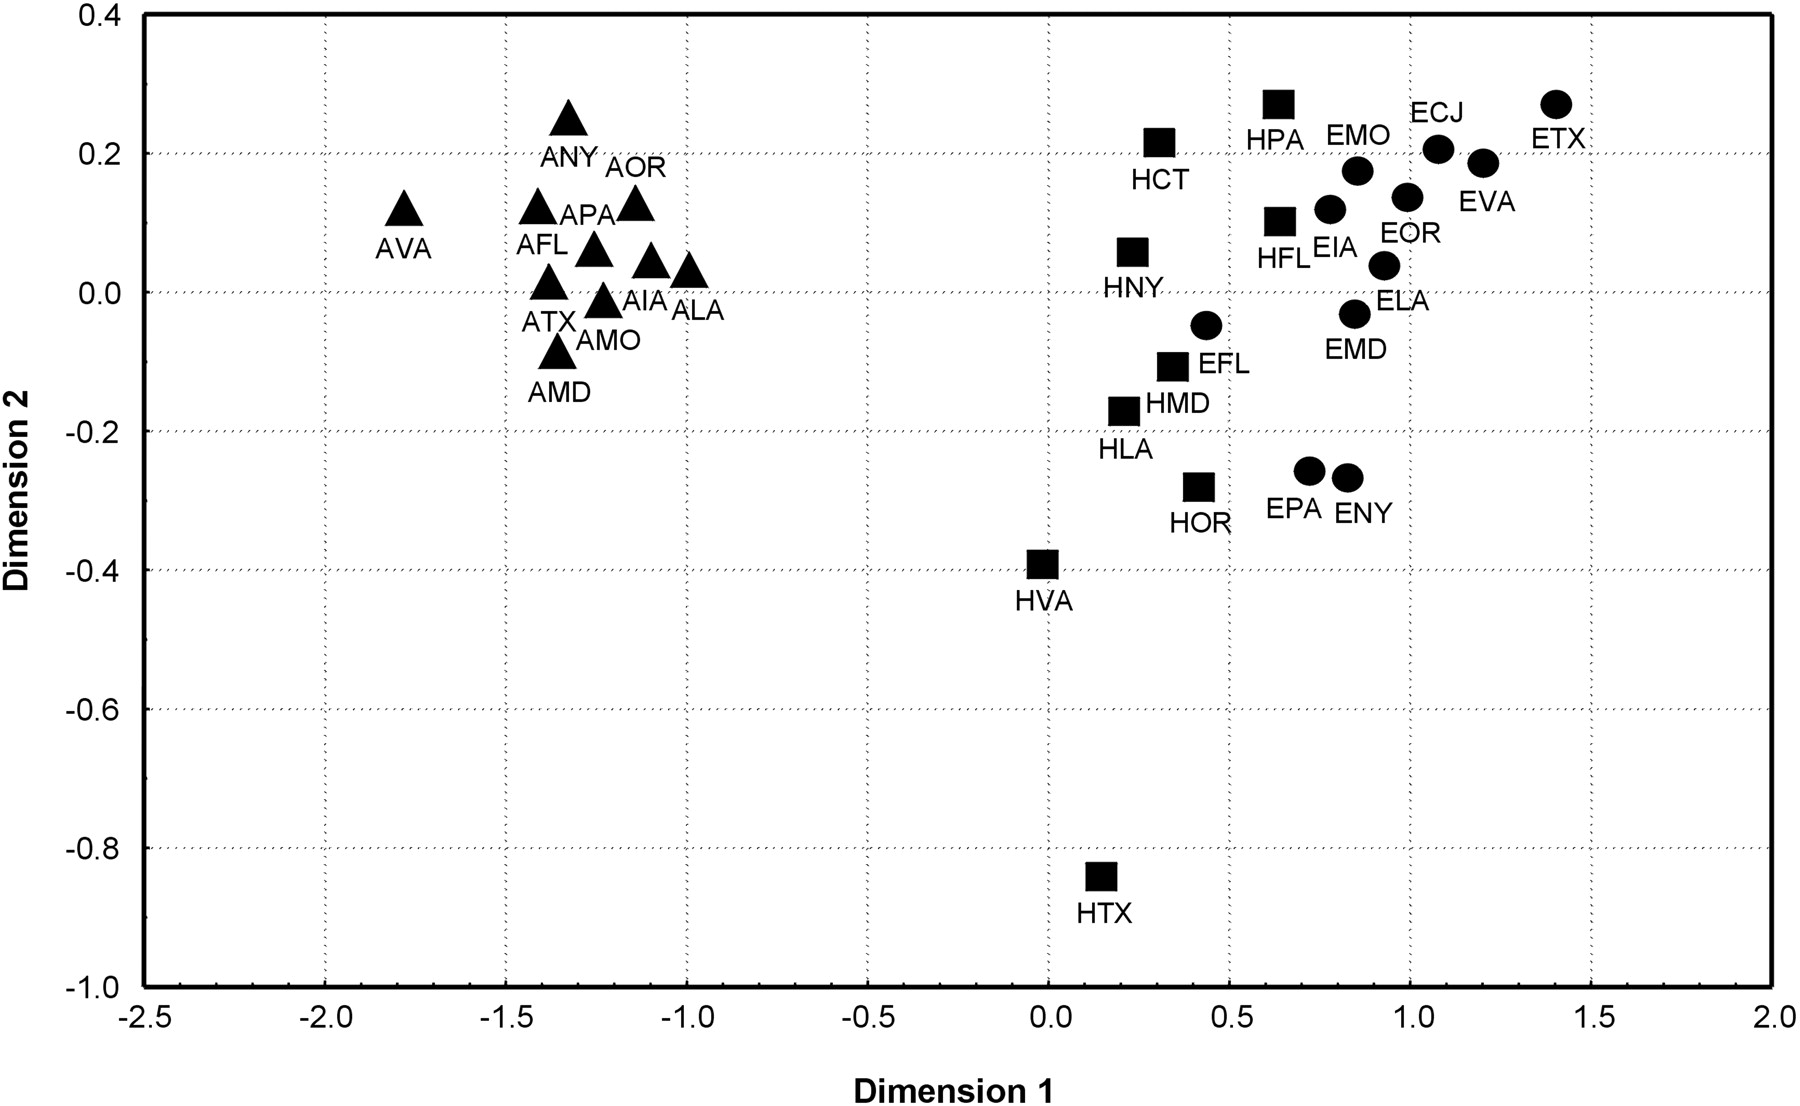
MDS plot based on RST values for Y-STR haplotypes for U.S. groups. Codes are from Table 1. (▴) African-Americans; (●) European-Americans; (▪) Hispanics.
(Downloading may take up to 30 seconds. If the slide opens in your browser, select File -> Save As to save it.)
Click on image to view larger version.
MDS plot based on RST values for Y-STR haplotypes for U.S. groups. Codes are from Table 1. (▴) African-Americans; (●) European-Americans; (▪) Hispanics.
 CiteULike
 Delicious
 Digg
Digg Facebook
 Google+
 Reddit
 Twitter
