
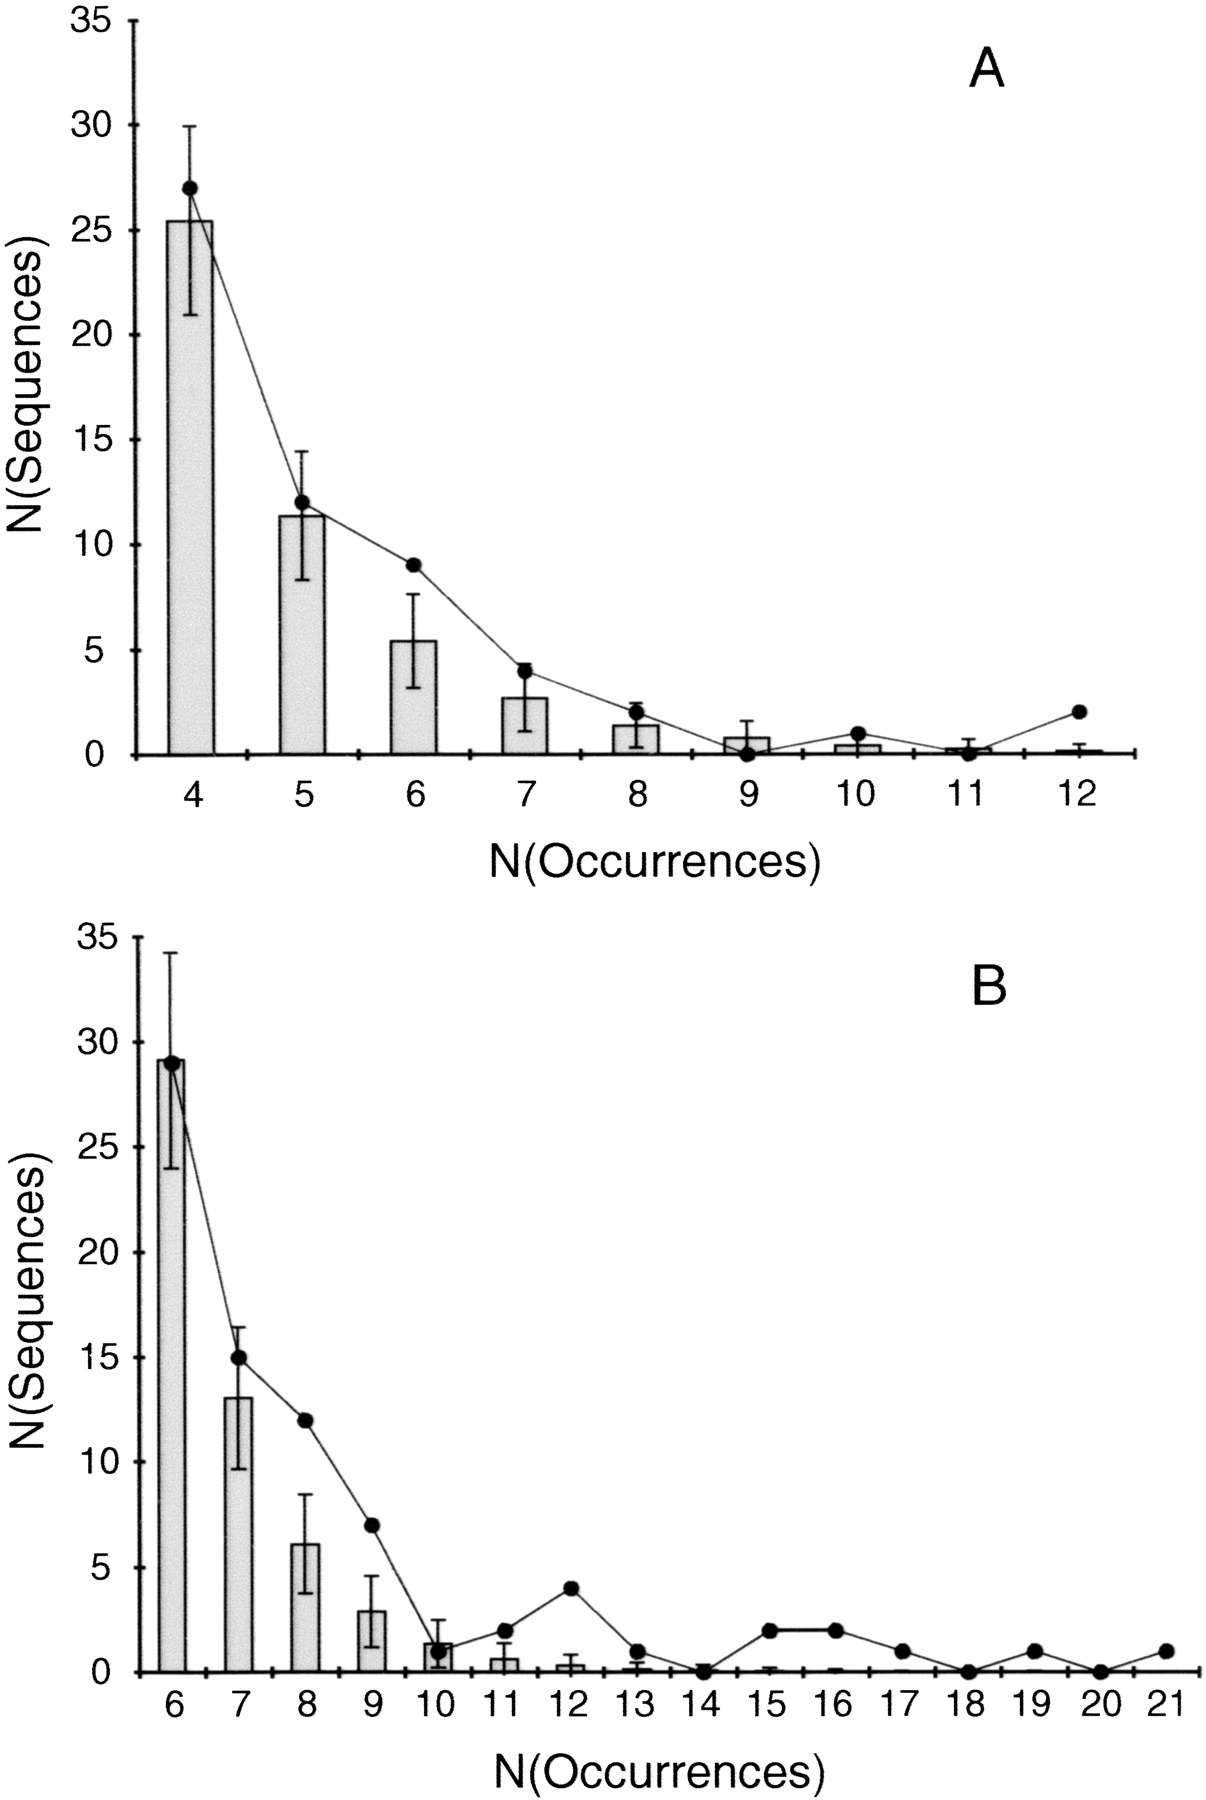
Figure 1.
Comparison of observed vs. expected sequence occurrences inMethanococcus jannaschii (A) and Saccharomyces cerevisiae (B). The number of tripeptide sequences is plotted as a function of the number of times that that sequence occurs in the genome. The line indicates the genomic data, and the bars show the results from 1000 iterations of the jumbling procedure. Error bars are drawn at one standard deviation.


