
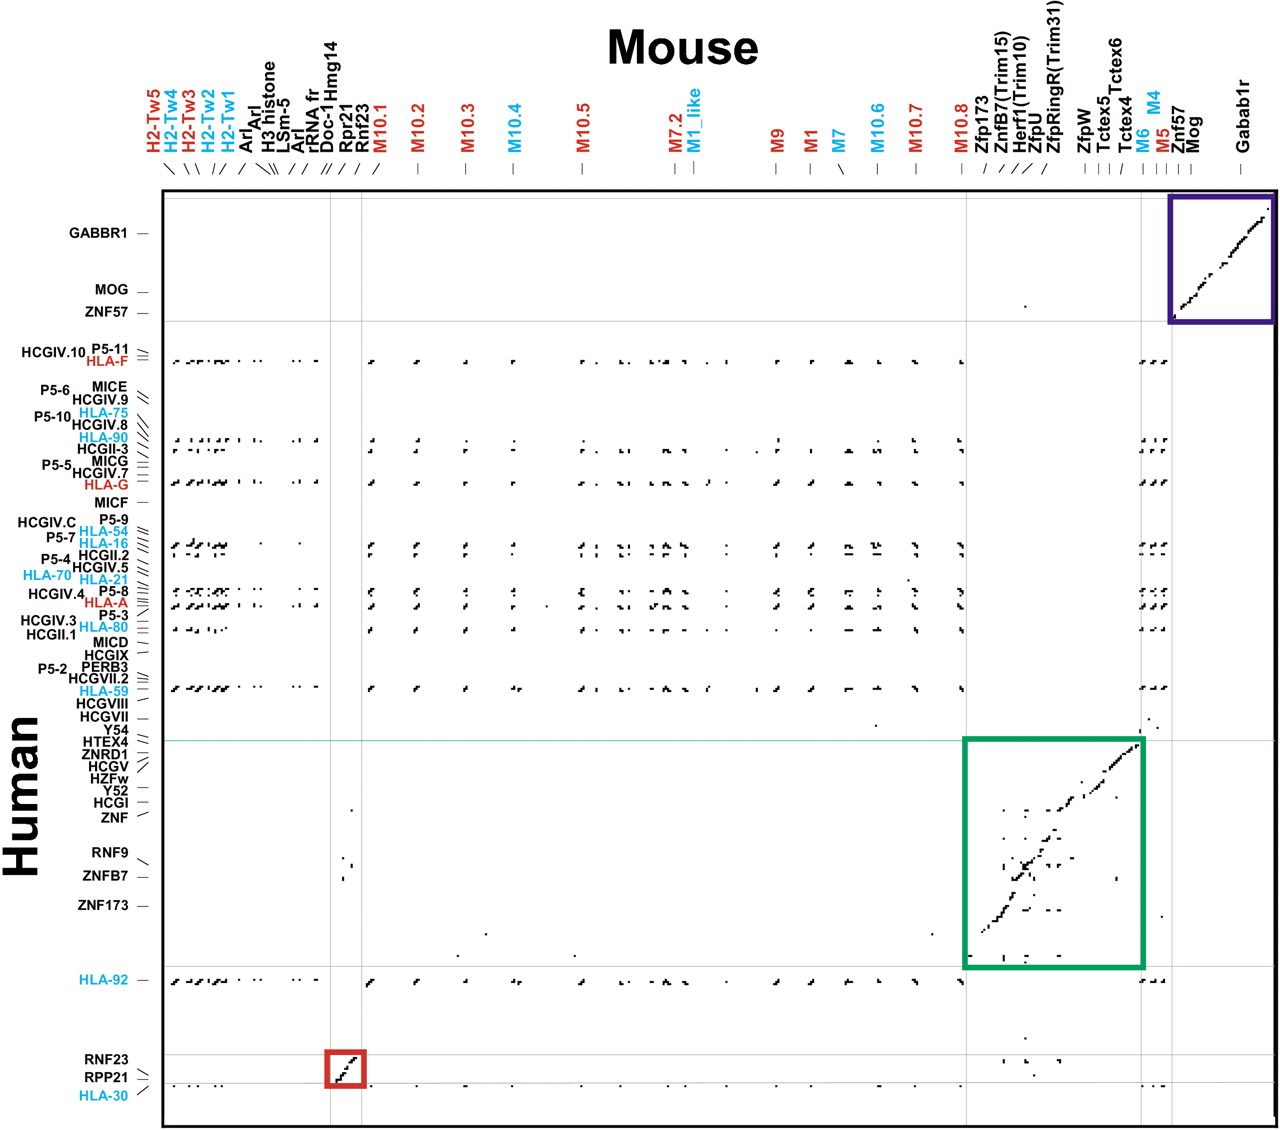
Figure 5.
Dot matrix analysis of the telomeric class I region of mouse and man. The 951,695-bp sequence of the centromeric H2-M region is compared with 853,185 bp of the HLA region (accession no. NF_001520). Class I genes are red, class I pseudogenes are blue; other genes and pseudogenes are black. The red, green, and blue boxes mark the three framework regions that are conserved syntenic regions of orthologous nonclass I genes, which yield clear diagonal lines on the dot matrix. The class I genes give only short lines of similarity between paralogous genes.


