
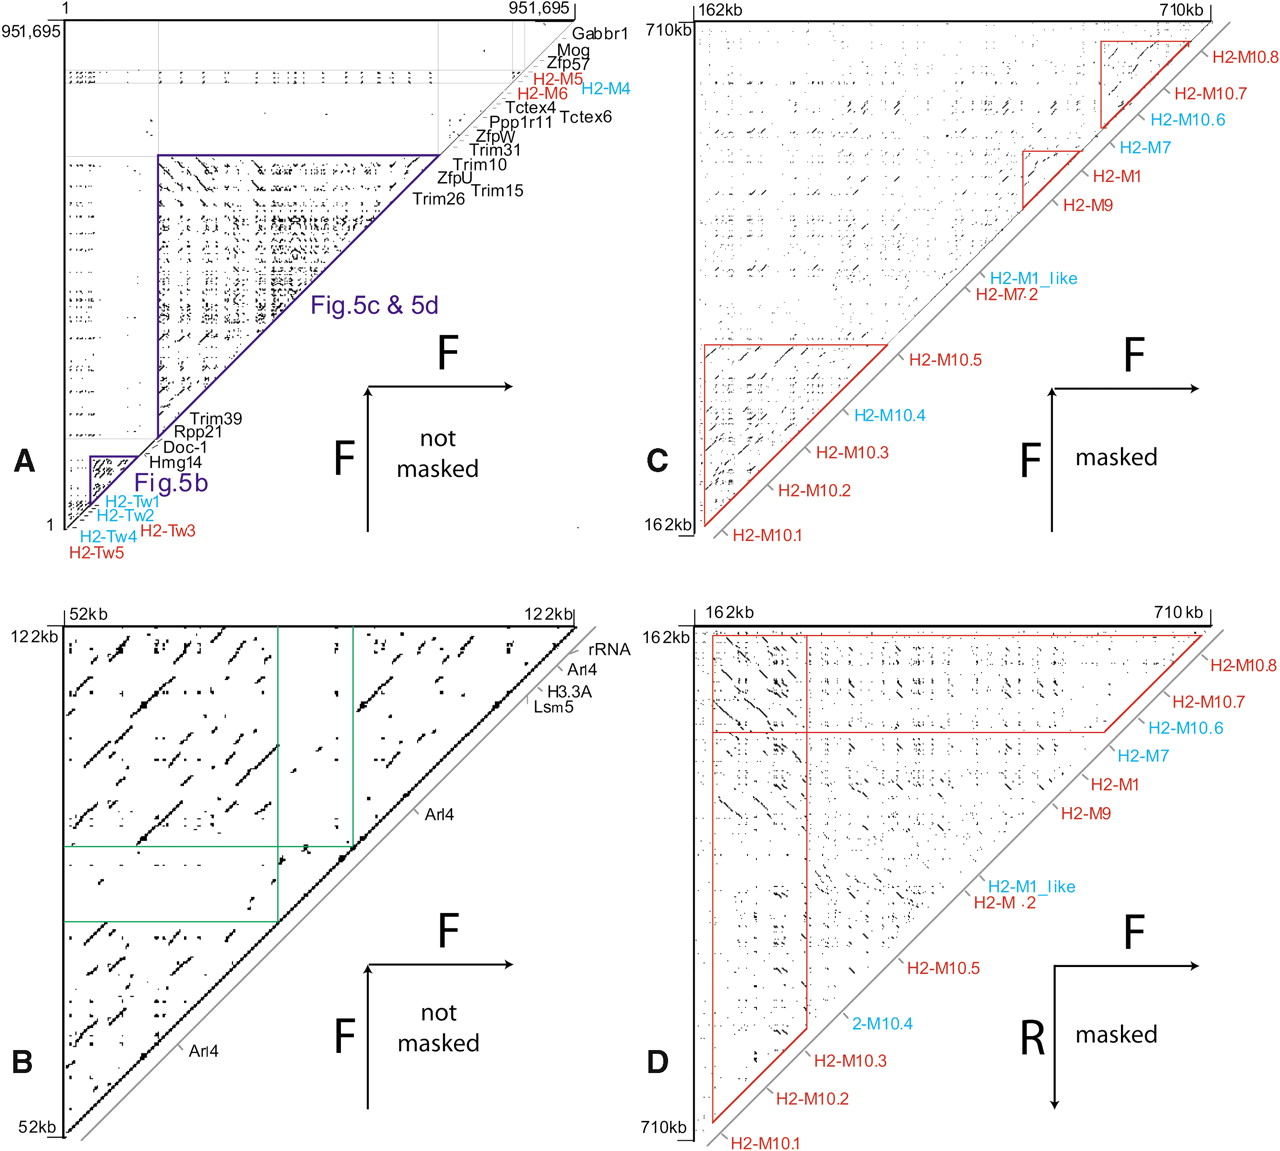
Figure 4.
Dot matrix analysis of the 951,695 bp sequence of the H2-Mregion against itself. (A) Segmental duplication and inversion of the class I genes is evident in the central box. This plot was generated with PipMaker, set to compare both strands and show all matches. (B) Self-comparison of the 70-kb region rich in pseudogenes for nuclear proteins. (C) Forward and (D) reverse self-comparison of the 520-kb M1-M10 region. The genome-wide repeats are masked in plots (C) and (D), whereas plots (A) and (B) are not masked.


