
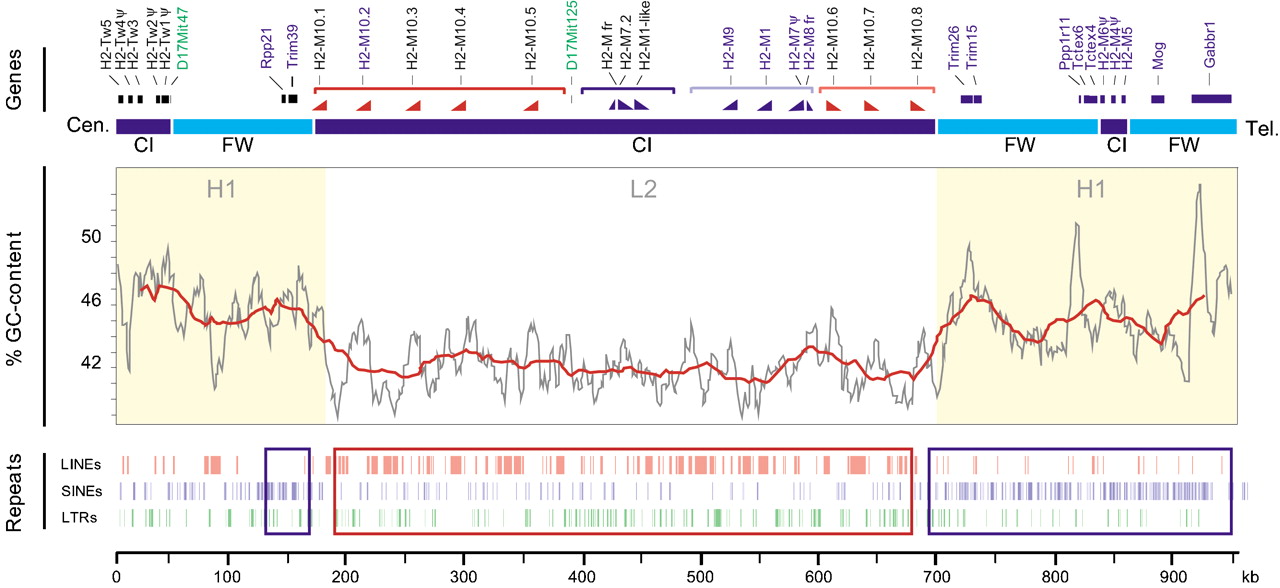
Gene, isochore, and repeat content in the centromeric H2-Mregion. Genes and markers are indicated on top by name, with already known genes in blue, newly identified class I genes in black, and microsatellites in green. The bar marks framework (FW) regions and class I (CI) expansion zones in light and dark blue. The GC-content in percentage was calculated using an 8-kb window/1-kb shift (grey line) and a 40-kb window/10-kb shift (red line) sliding window analysis. The class I gene-rich region from H2-M10.1 to H2-M10.8forms an L2 isochore with an average of 42% GC, and it is surrounded by H1 isochores with an average of 45% GC. The distribution of repetitive elements is indicated in the bottom part of the figure. Red and blue boxes mark regions particularly rich in LINEs and SINEs, respectively. The class I gene orientation is indicated to help to understand the duplications and inversions that may have given rise to the present day H2-M1 (light and dark blue) andH2-M10 (light and dark orange) families.


