
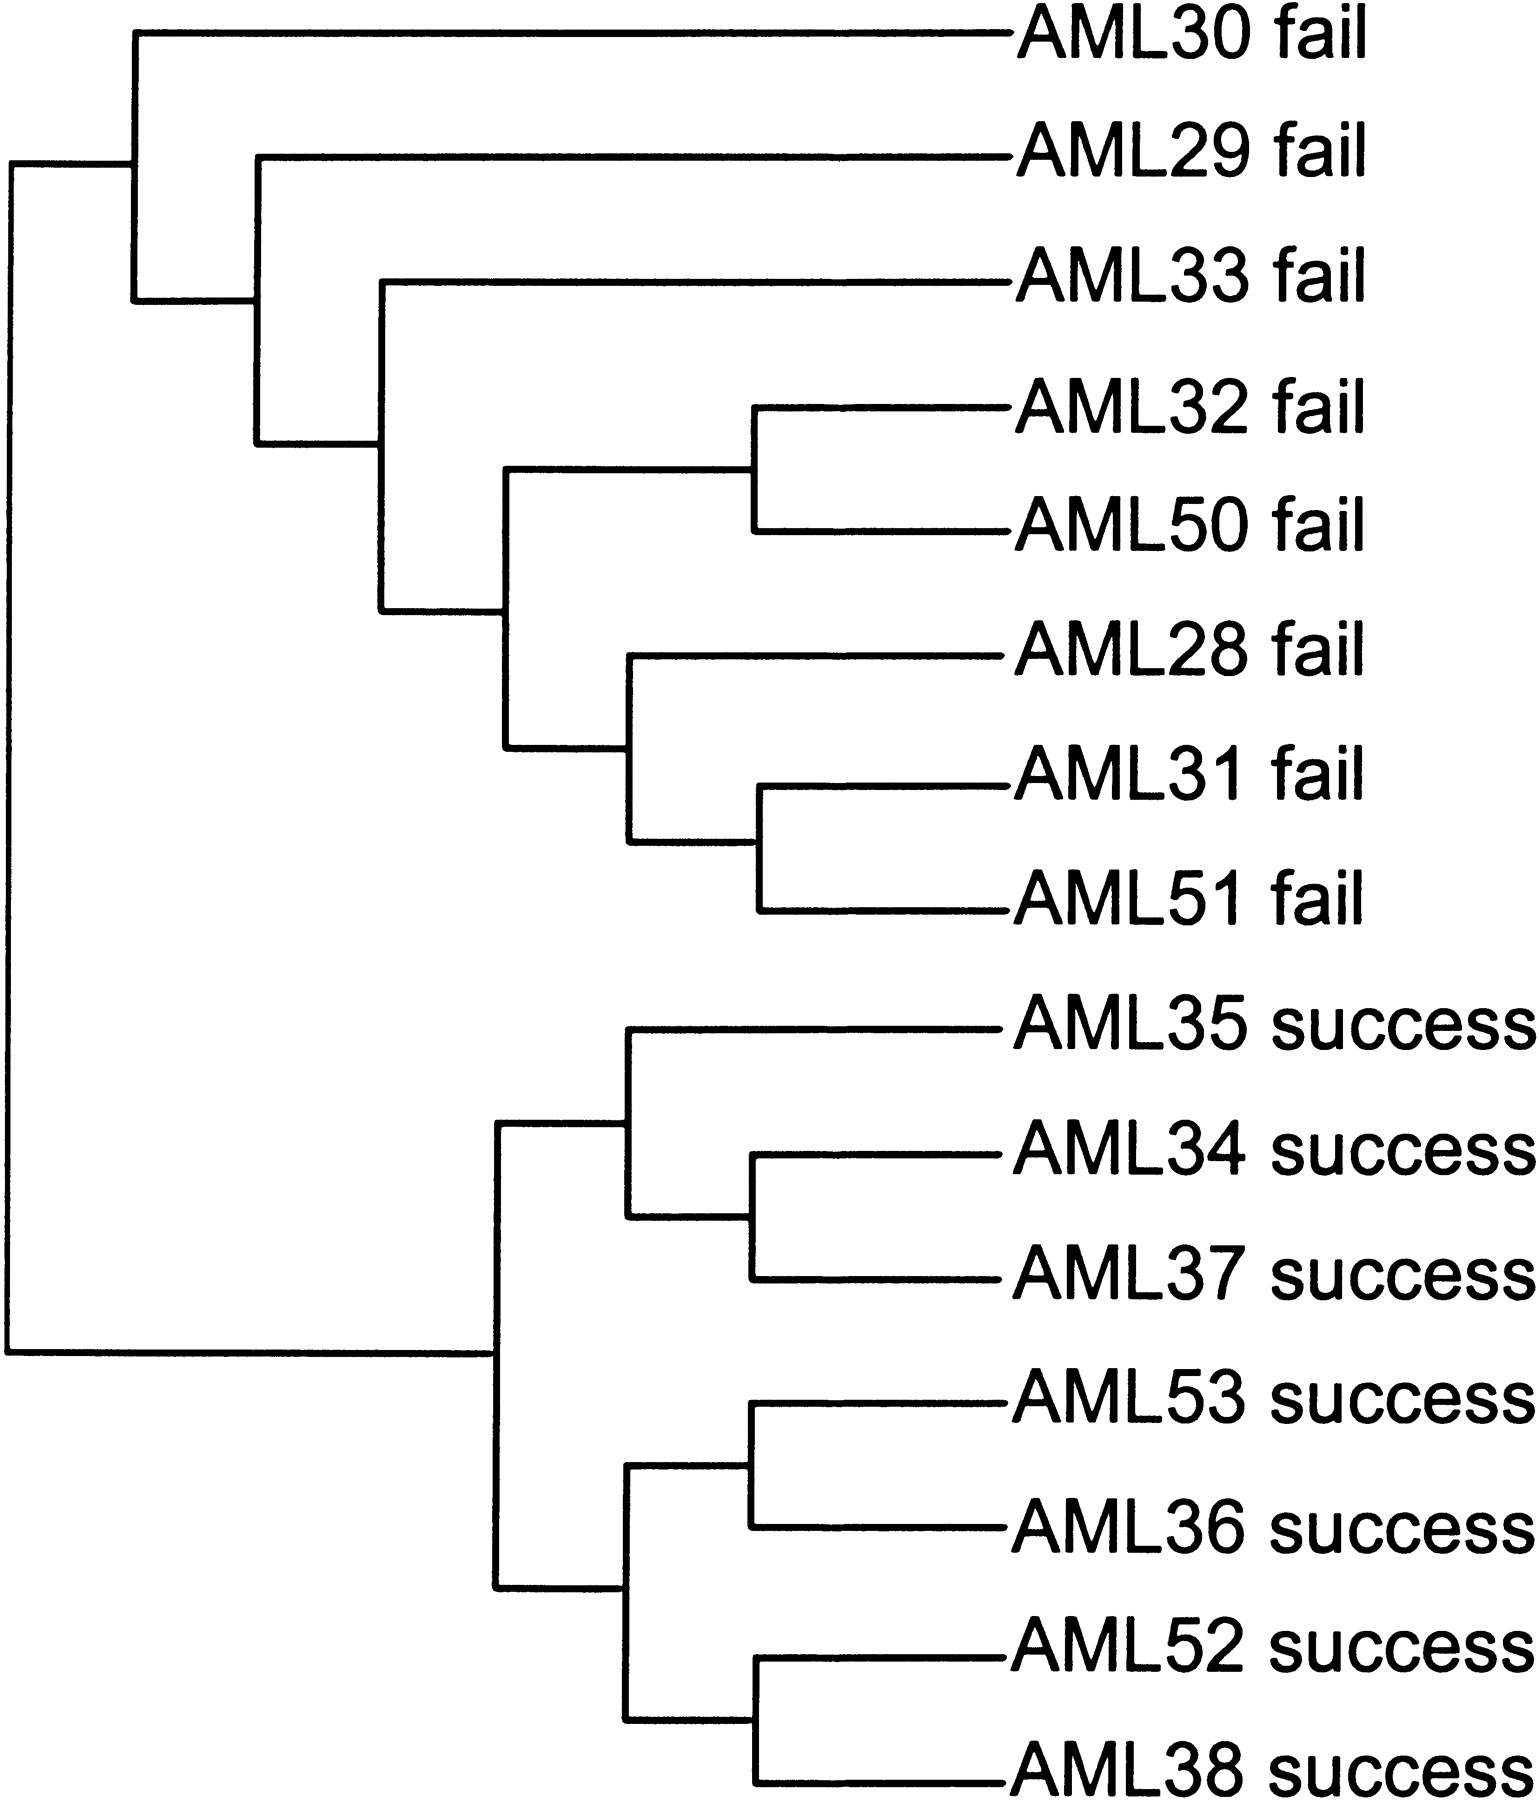
Figure 3.
Average-linkage hierarchical cluster diagram of the tumors associated with success and failure of chemotherapy using the 12 genes in the overall MDSS (no transformation, distance = 1 − Pearson correlation coefficient). This gene set fails to distinguish between successes and failures when the data are log-transformed (data not shown). The hierarchical classification shows a clear distinction between successes and failures.


