
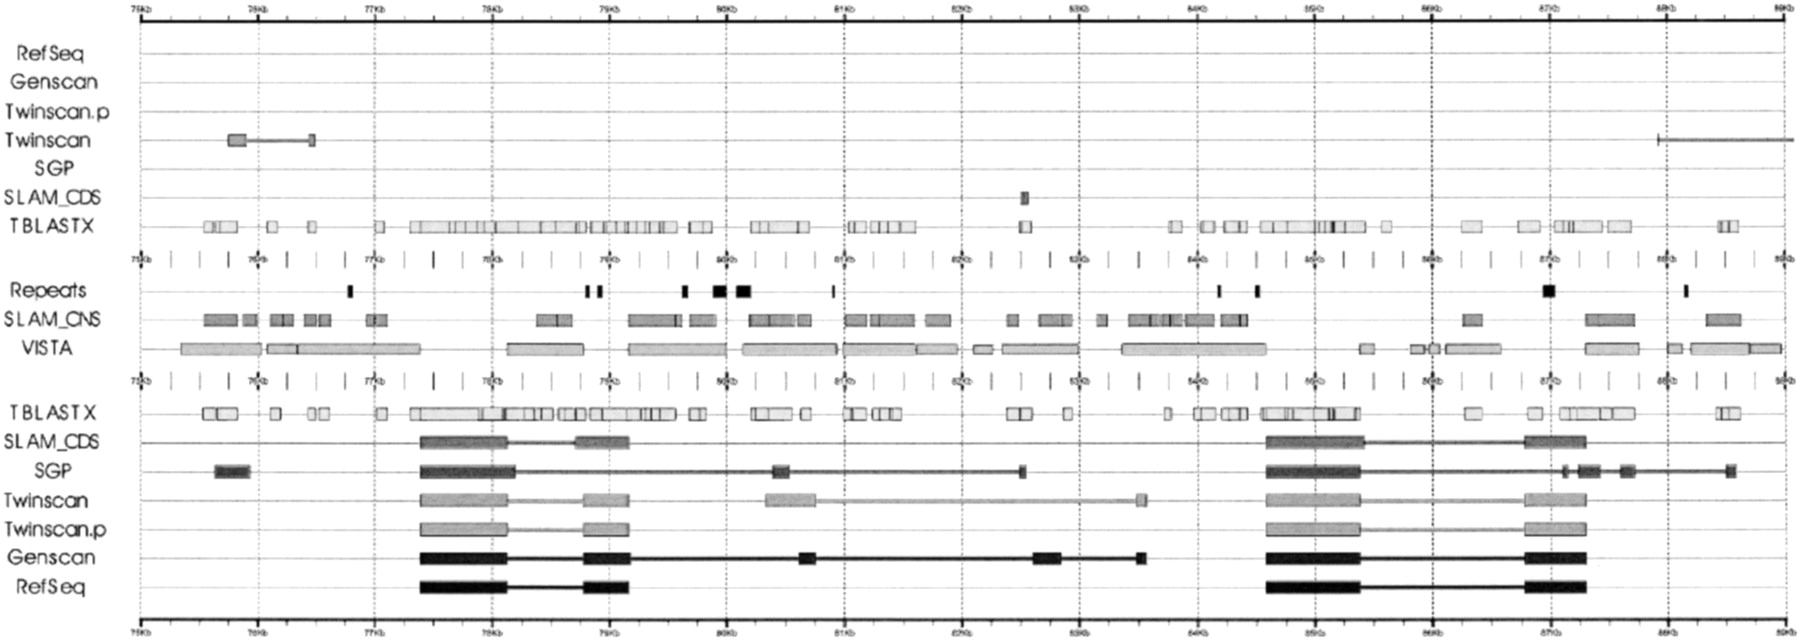
Figure 1.
Fourteen thousand bp from the HoxA cluster showing the HoxA2 and HoxA3 genes. The top half of the figure consists of predictions and annotations for the 5′ → 3′ strand and the bottom half for the 3′ → 5′ strand. The tracks shown are: RefSeq annotations, GENSCAN, TWINSCAN, SGP-2, and SLAM predictions, Repeats masked by RepeatMasker (A. Smit and P. Green, unpubl.), TBLASTX alignments, and SLAM and VISTA CNS annotations. The figure was created using gff2ps by J.F. Abril and R. Guigó, available athttp://www1.imim.es/software/gfftools/GFF2PS.html.


