
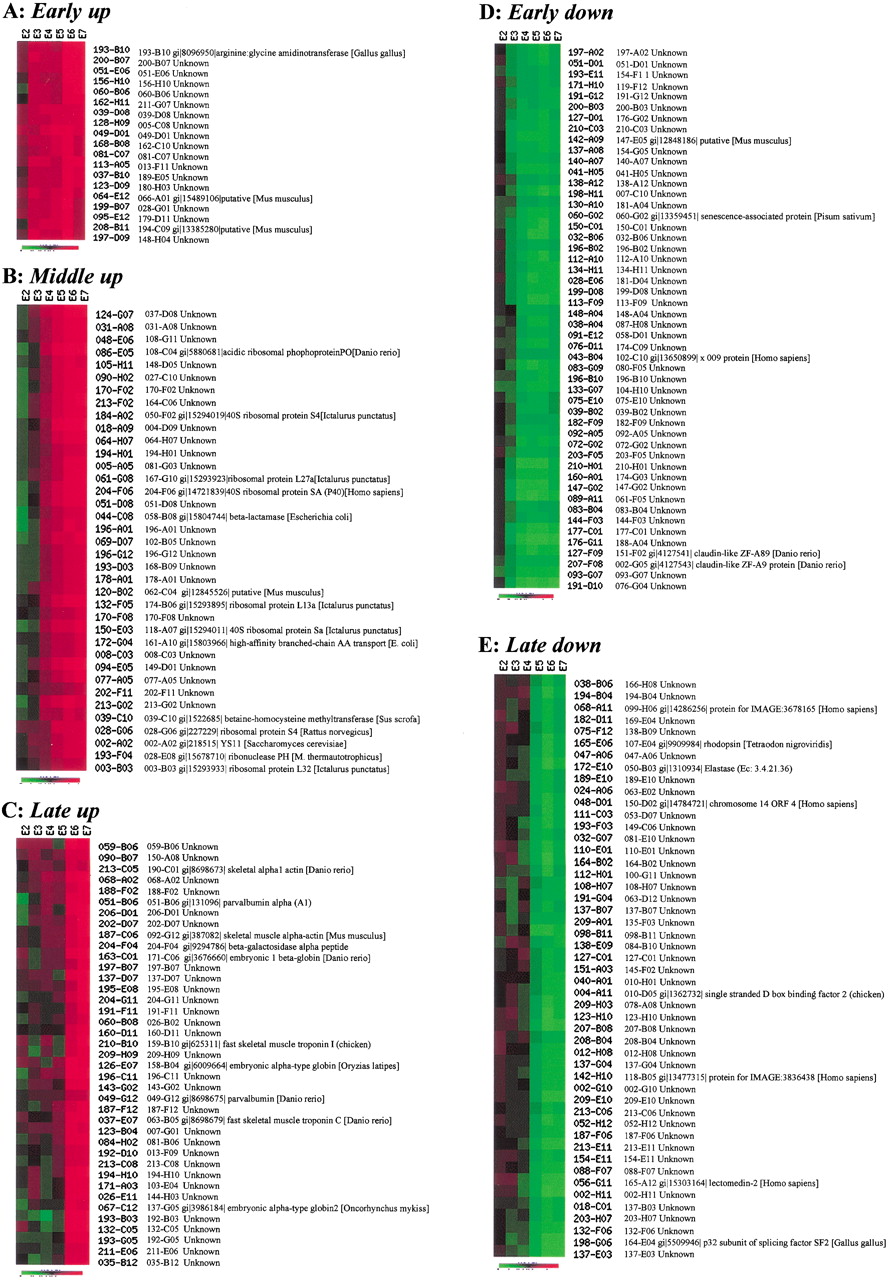
Examples of gene expression profiling during zebrafish embryogenesis using the K-means clustering method. For hierarchical
and K-means clustering, Euclidean distance was applied to divide all expression data into 20 clusters. Of that, seven were
selected to form five clusters (groups). The five groups were subjected to screening to get rid of the redundant cluster ID
and annotation ID before the final presentation. (A) Patterns for genes significantly up-regulated at the E3 stage. (B) Patterns for genes significantly up-regulated at the E4 or E5 stages. The expression of most genes for ribosomal proteins
displayed such patterns (Supplementary Fig. 2). (C) Patterns for genes significantly up-regulated at the E6 stage. The expression of many genes for muscle-specific proteins
displayed such patterns (Supplementary Fig. 3). (D) Patterns for genes down-regulated at the E3 or E4 stages. (E) Patterns for genes down-regulated at the E5 or E6 stages. Samples of the various stages for microarray probe labeling and
Northern blots were collected on the basis of the staging series as described in Kimmel et al. (1995). One to two stages were
collected to represent one period of embryos. Altogether, seven periods were collected. E1, the zygotic period, was omitted
in the experiment. (E0) Unfertilized; (E2) cleavage (four- to eight-cell); (E3) blastula (4–4⅓ h); (E4) gastrula (5¼ to 5
 h); (E5) segmentation (6 to 10 somites); (E6) pharyngula (24 h); (E7) hatching (72 h). M. thermautotrophicus = Methanothermobacter
thermautotrophicus.
h); (E5) segmentation (6 to 10 somites); (E6) pharyngula (24 h); (E7) hatching (72 h). M. thermautotrophicus = Methanothermobacter
thermautotrophicus.


