
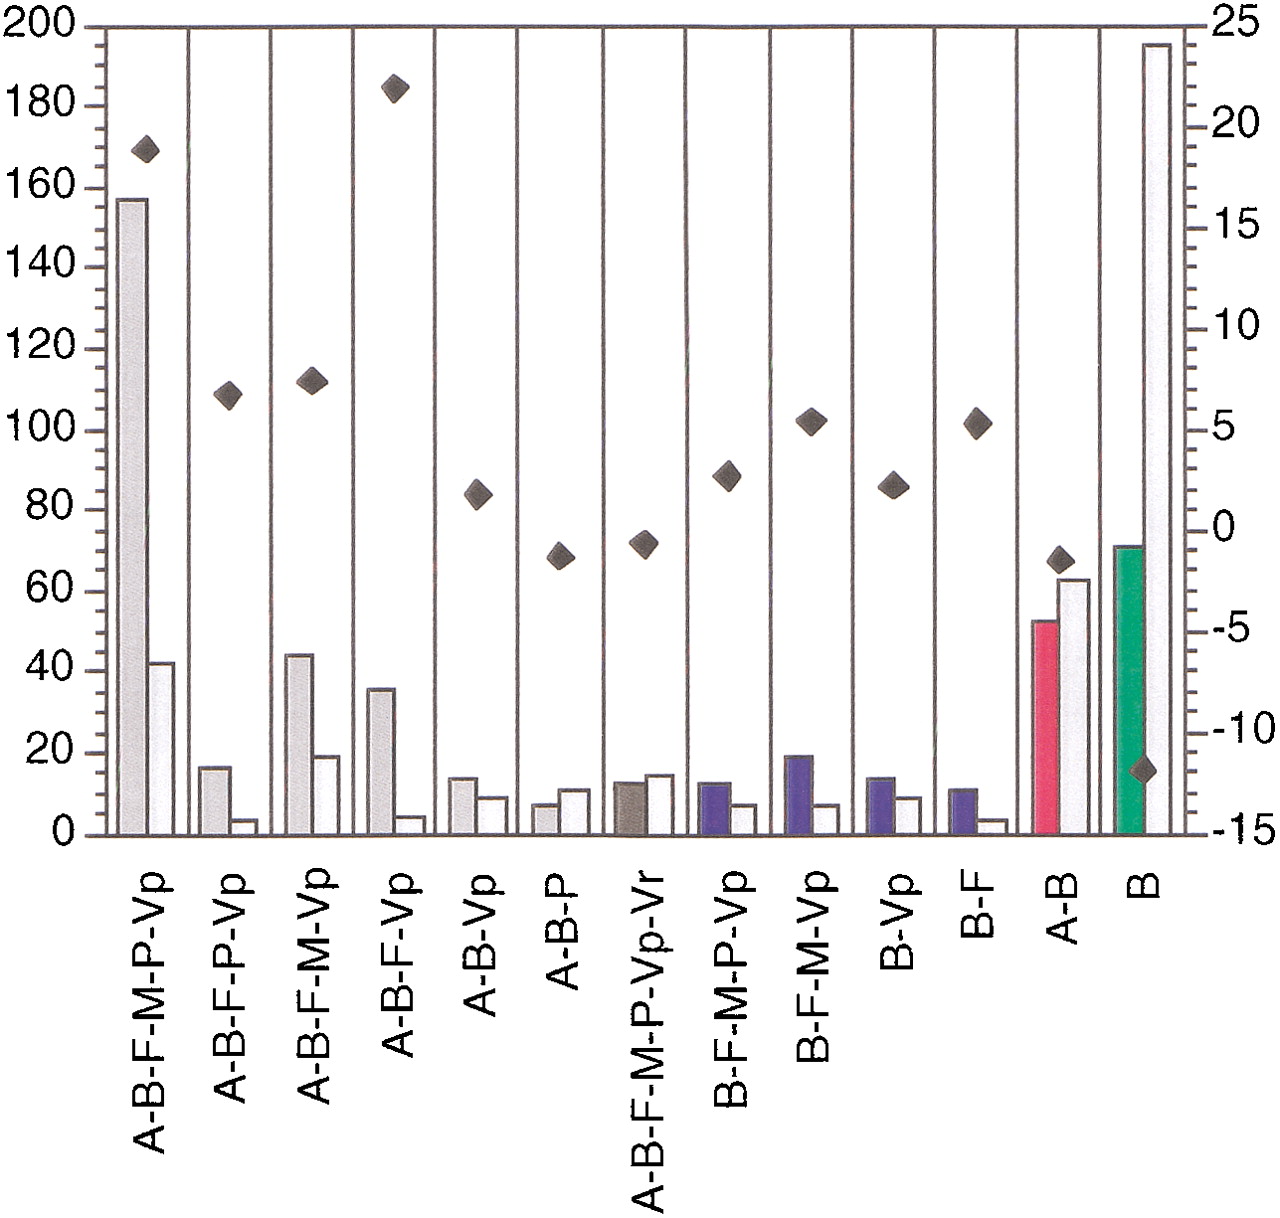
Figure 3.
Statistics of phylogenetic distribution of E. coli enzymes. The 13 statistically significant taxonomic combinations are shown on the x-axis (color coding as in Fig. 1; for taxonomic abbreviations see Methods). Frequency of enzymes belonging to the corresponding taxonomic combination (left bars, colored), compared to the mean value of 30 control runs (right bars, hatched), is shown on the left y-axis. Variance estimates for the mean values are not shown, for clarity. Black diamonds represent Z-score values (see Methods for details); scale is shown on the right y-axis.


