
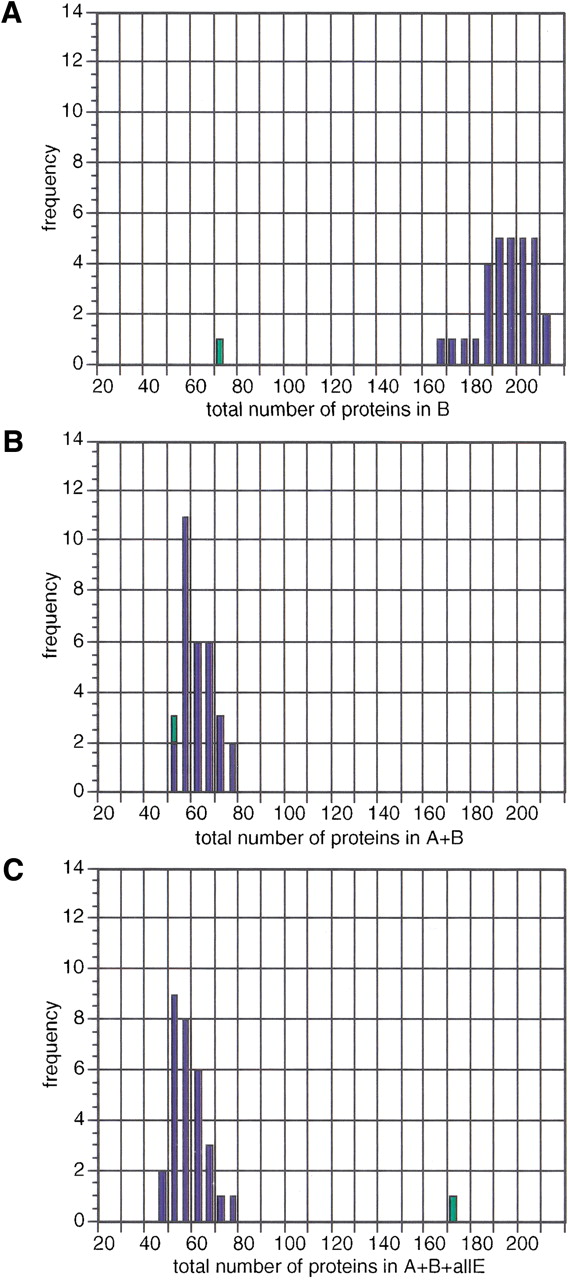
Figure 2.
Frequency distributions of E. coli metabolic enzymes (green bars) versus 30 control sets of equal size with randomly selectedE. coli proteins (blue bars, see Methods) in (A) Bacteria, (B) Bacteria and Archaea or (C) Bacteria, Archaea and all eukaryotic groups (including viruses). Counts are shown on the x-axis and the frequency of the sets on they-axis. The set of E. coli enzymes are less likely to be present only in Bacteria than the control sets (A); conversely, the set of E. coli enzymes are more likely to be present in all phylogenetic groups than the control sets (C).


