
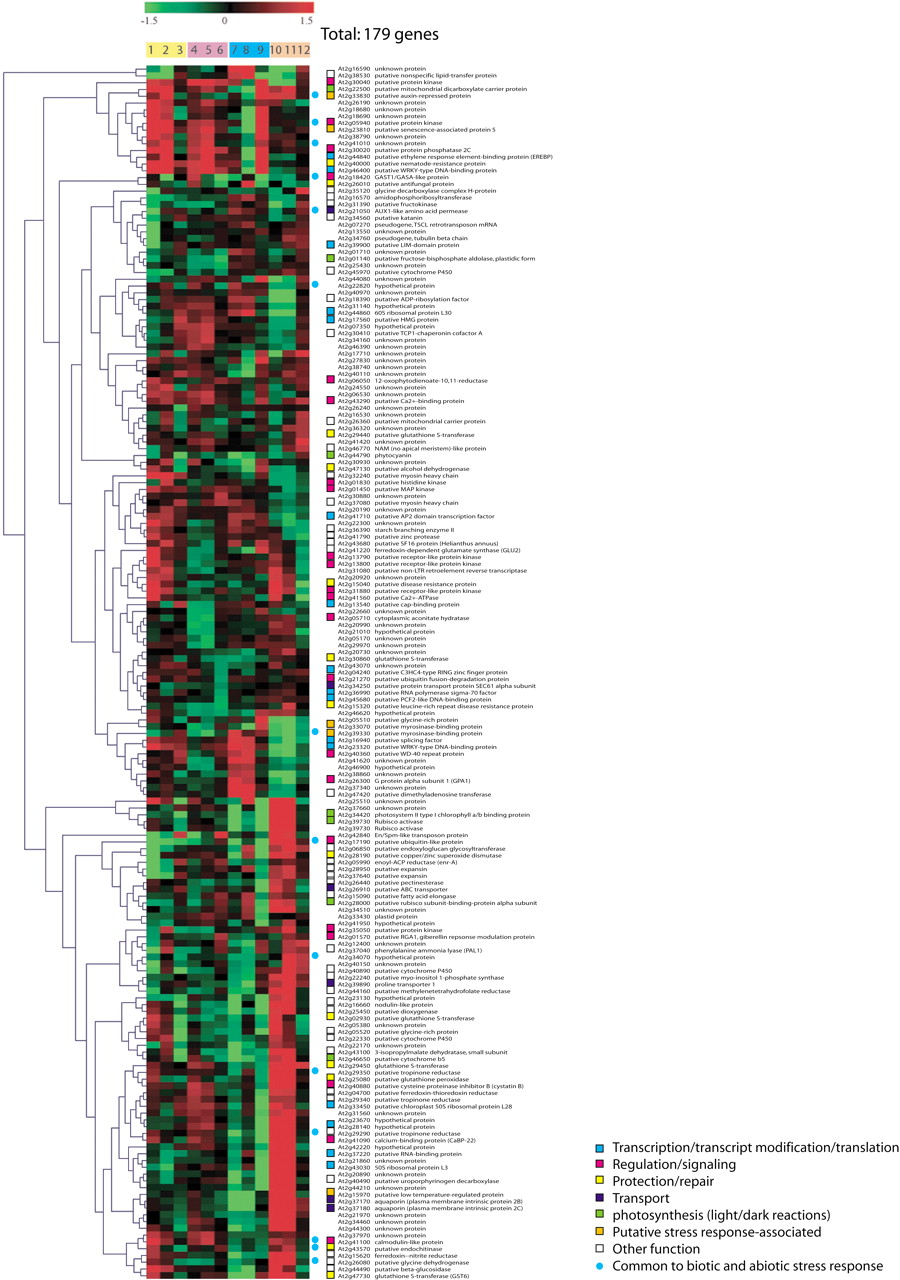
Figure 6.
Gene expression in various tissues. A total of 179 genes that showed significant differences in expression compared to corresponding reference samples were subjected to average linkage hierarchical clustering with a Euclidean distance metric. Predicted role categories are denoted by color-coded squares; genes also found to be significantly regulated in response to both abiotic and biotic stresses are denoted with blue circles.


