
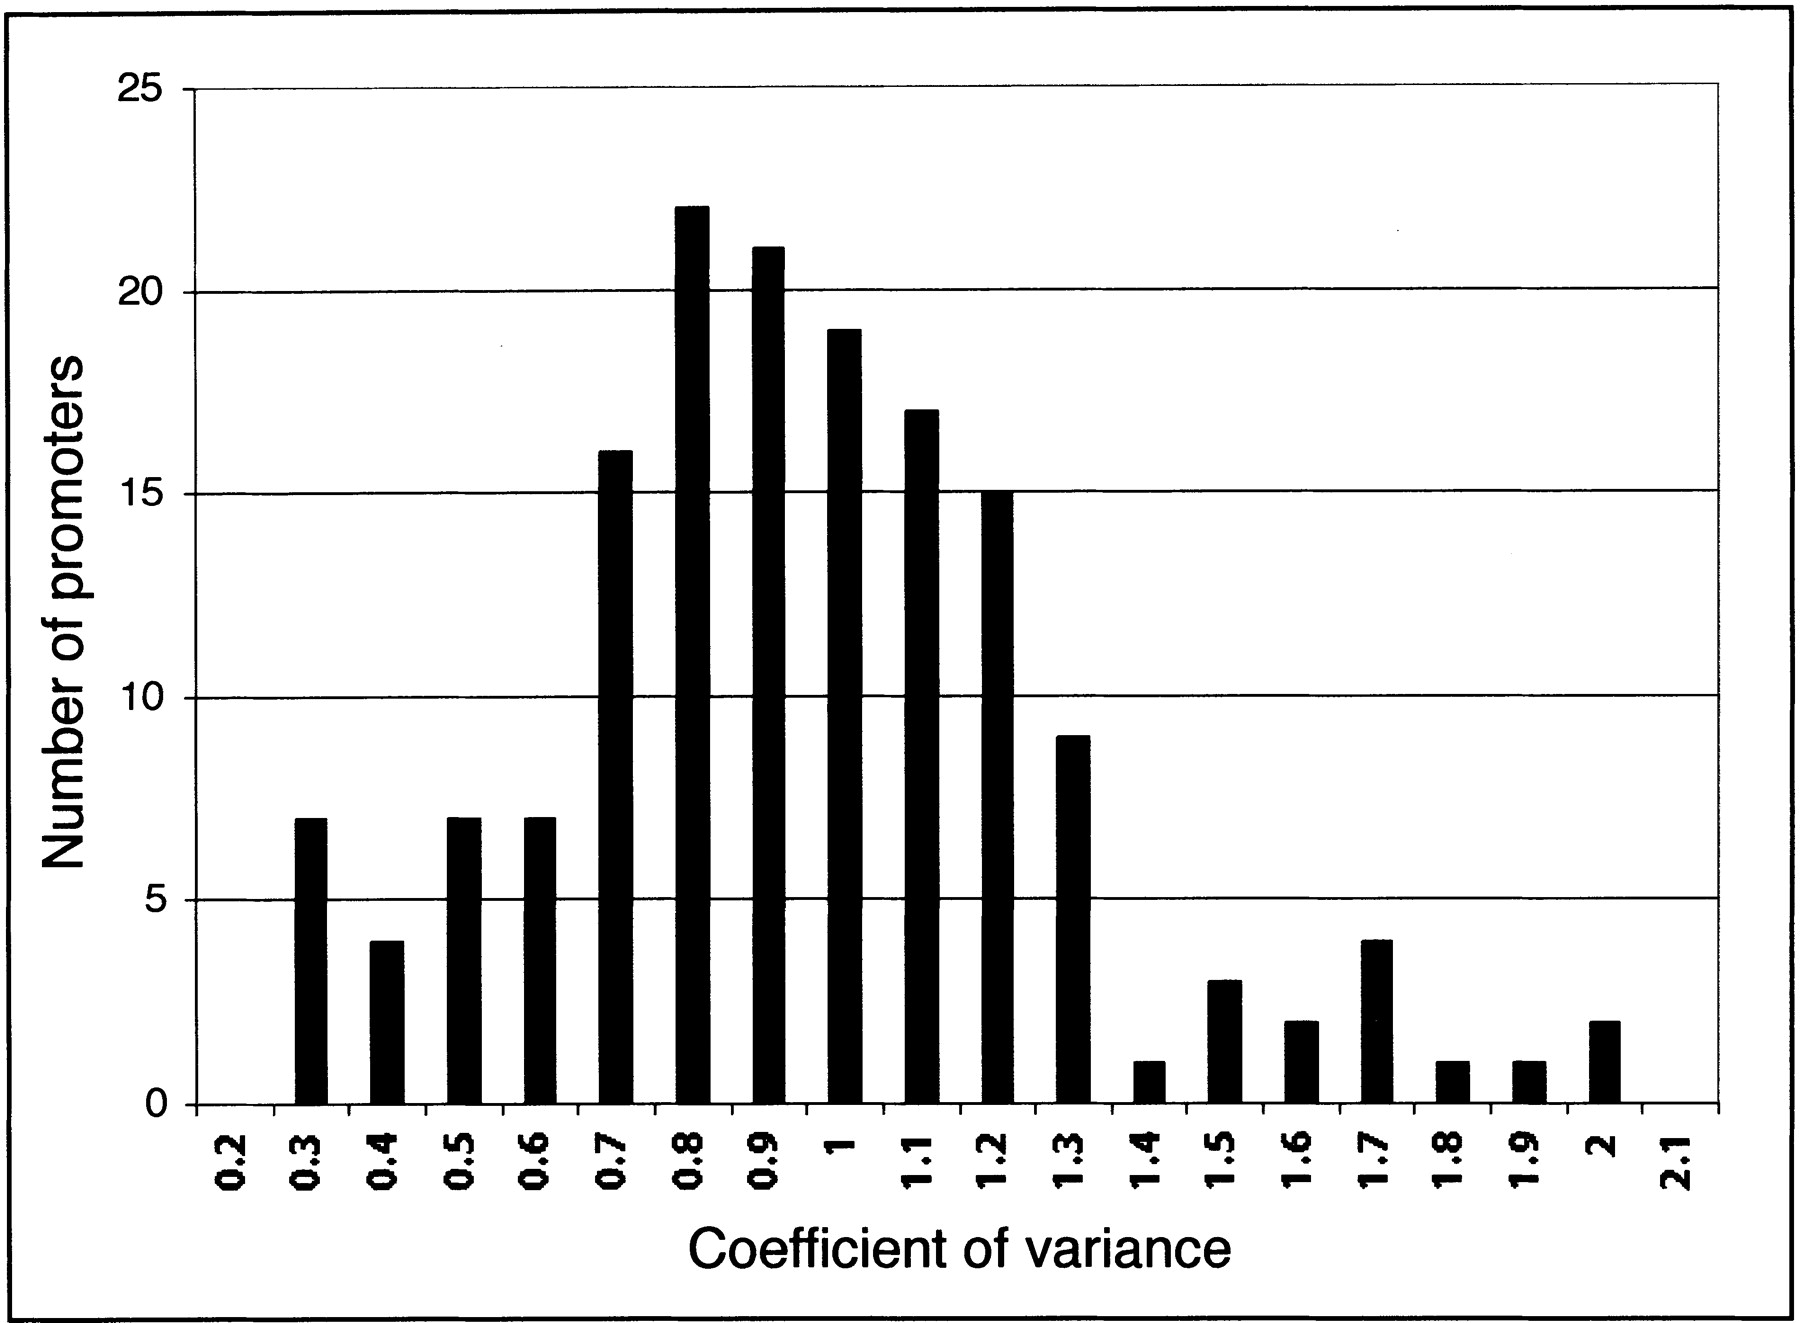
Figure 2.
Distribution of the variance of promoter strength. We calculated the coefficient of variance for each individual promoter in the four cell types to estimate the variance of promoter strength. By measuring the standard deviation relative to the mean, we compared the variation between both strong and weak promoters. The promoters in theleft tail (low variance) and right tail (high variance) of the distribution may be more likely to have constitutive and cell type-specific activities, respectively.


