
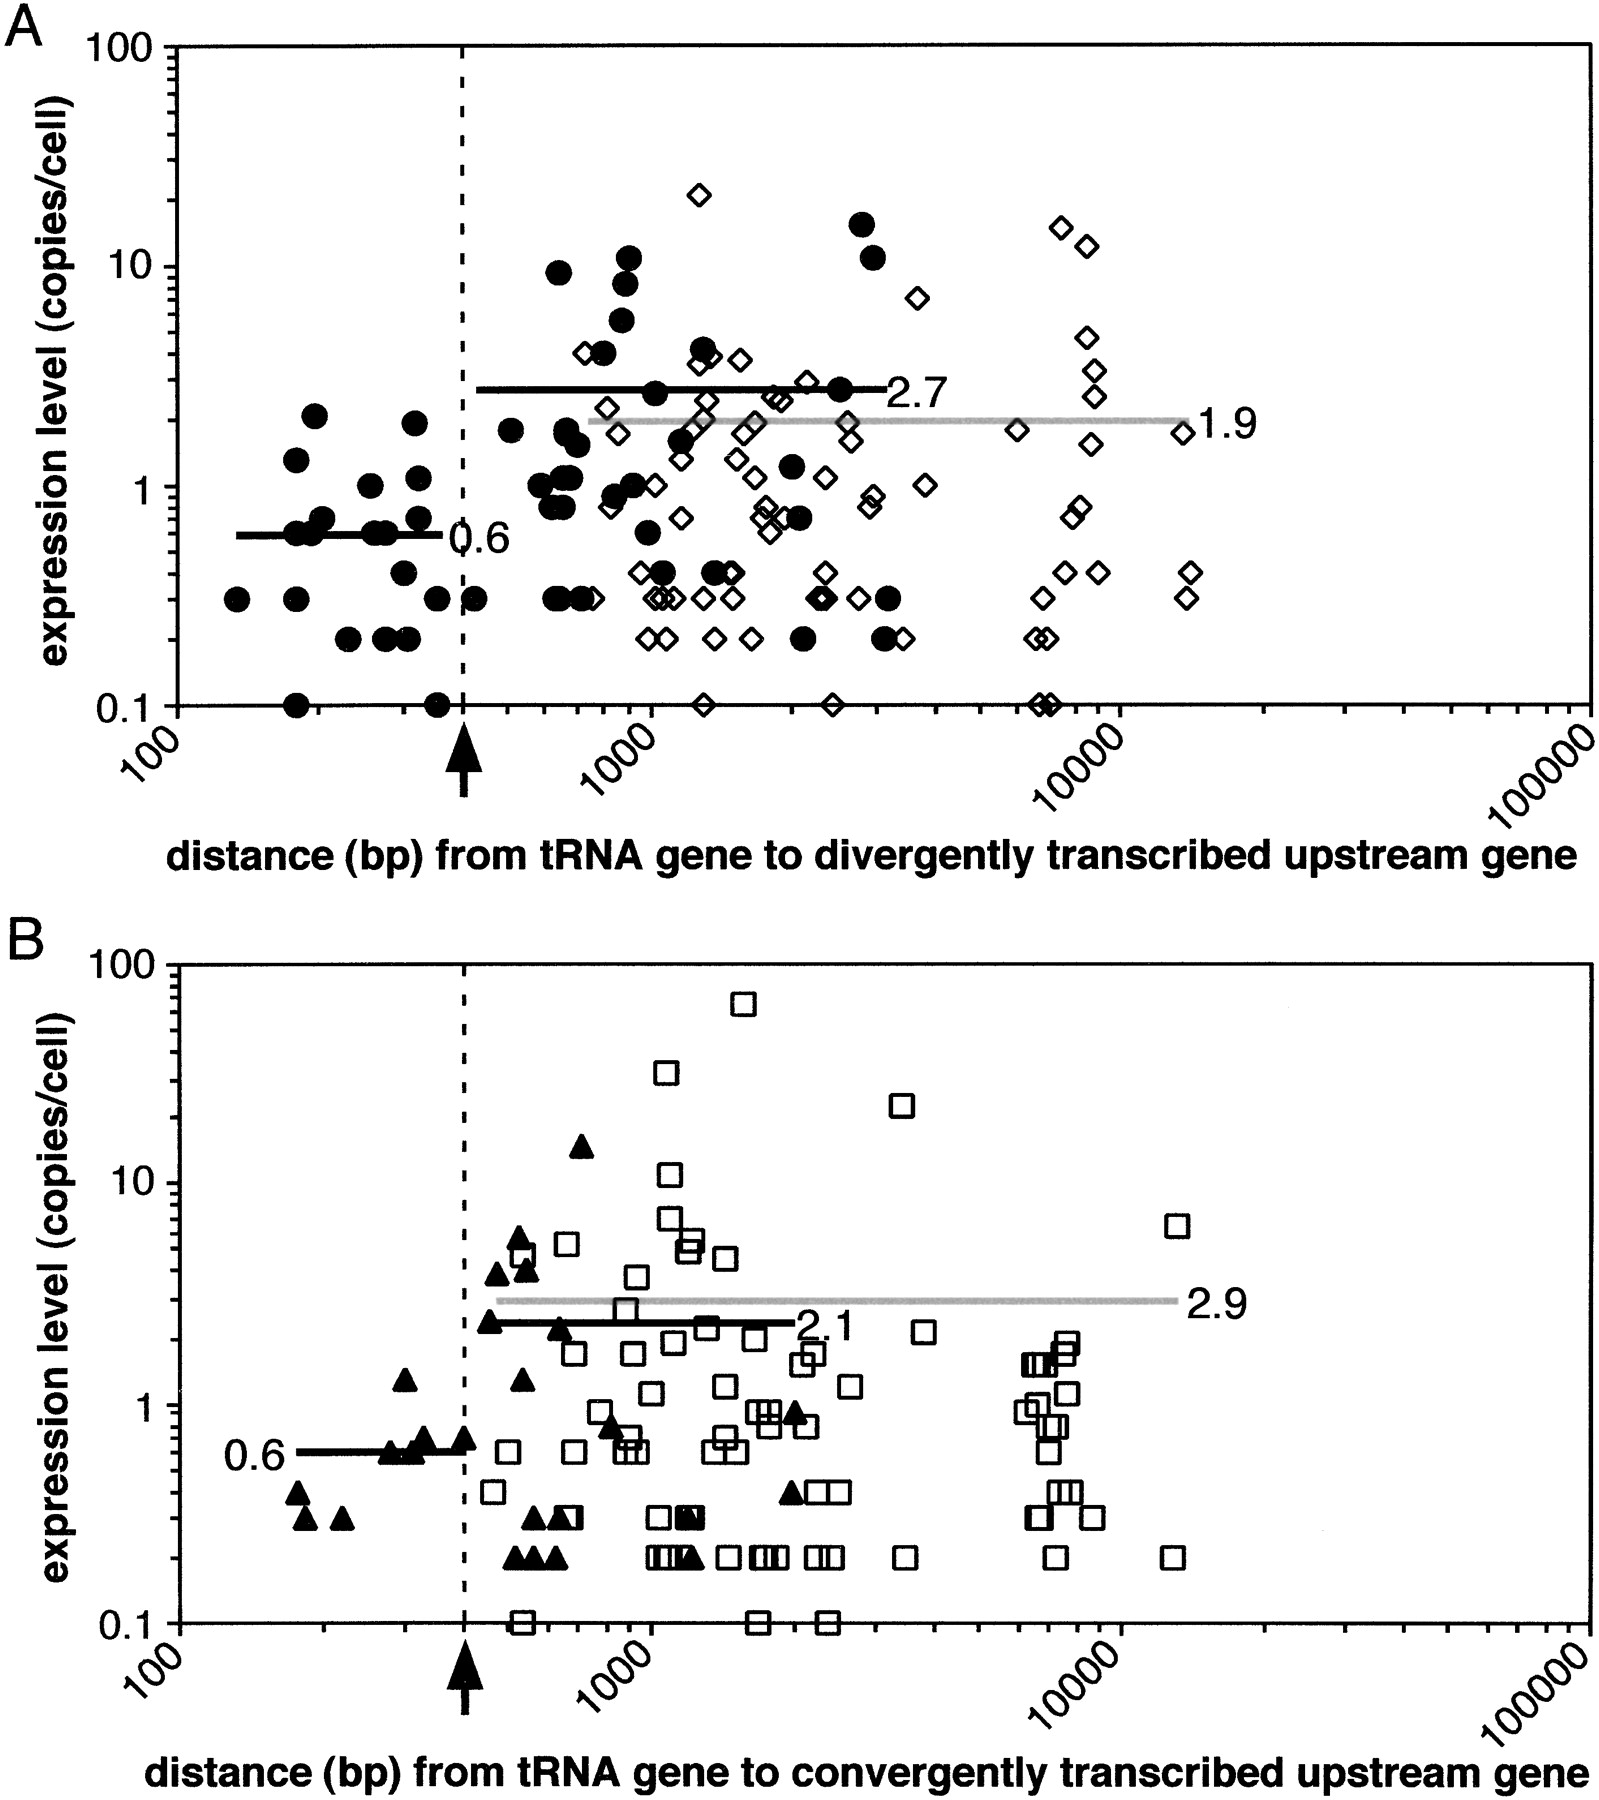
Expression level distribution of the genes upstream of tRNA genes. The expression level for each upstream gene is plotted versus the distance between the upstream ORF and the nearby tRNA gene. (A) Expression level versus intergenic distance for divergently transcribed genes at tRNA loci lacking (solid circles) and containing (open diamonds) upstream Ty sequences. (B) Expression level versus intergenic distance for convergently transcribed genes at tRNA loci lacking (solid triangles) and containing (open squares) upstream Ty sequences. The black arrow and broken black line indicate a 400-bp distance from the upstream gene to the tRNA gene. The horizontal lines (black for solid and gray for open symbols) and numbers represent the mean expression level for the distances spanned by the lines. Gene expression data is according to the yeast Transcriptome database (Holstege et al. 1998). Intergenic distance measurements were based on the ORF coordinates assigned by SGD and not the start sites of transcription, which remain to be determined for many genes.


