
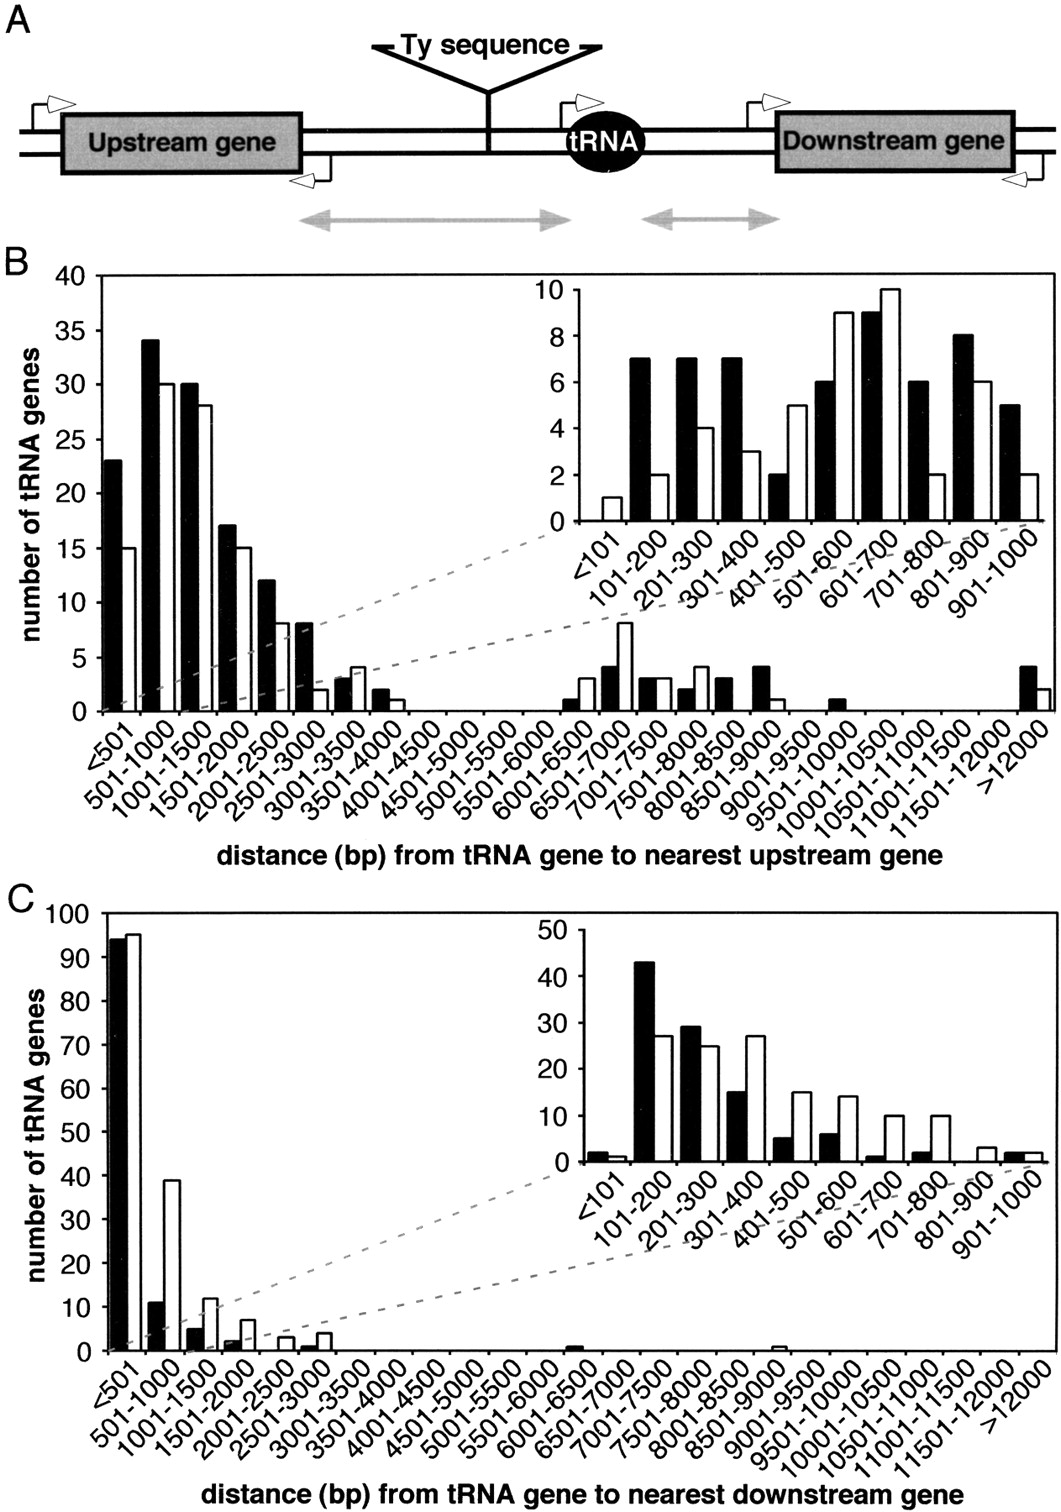
Figure 6.
Genomic distribution of the distances from tRNA genes to their nearest neighbor genes. (A) Cartoon of the generic tRNA locus in the yeast genome. The gray double-headed arrows represent the distances from tRNA genes to their nearest (B) upstream and (C) downstream genes. Solid bars represent tRNA genes that are transcribed in the opposite direction as the neighboring gene, and open bars represent tRNA genes that are transcribed in the same direction as the nearby gene. The minor peaks in the distributions for distances >6,000 and 12,000 bp indicate the presence of one or two full-length Ty elements, respectively.


