
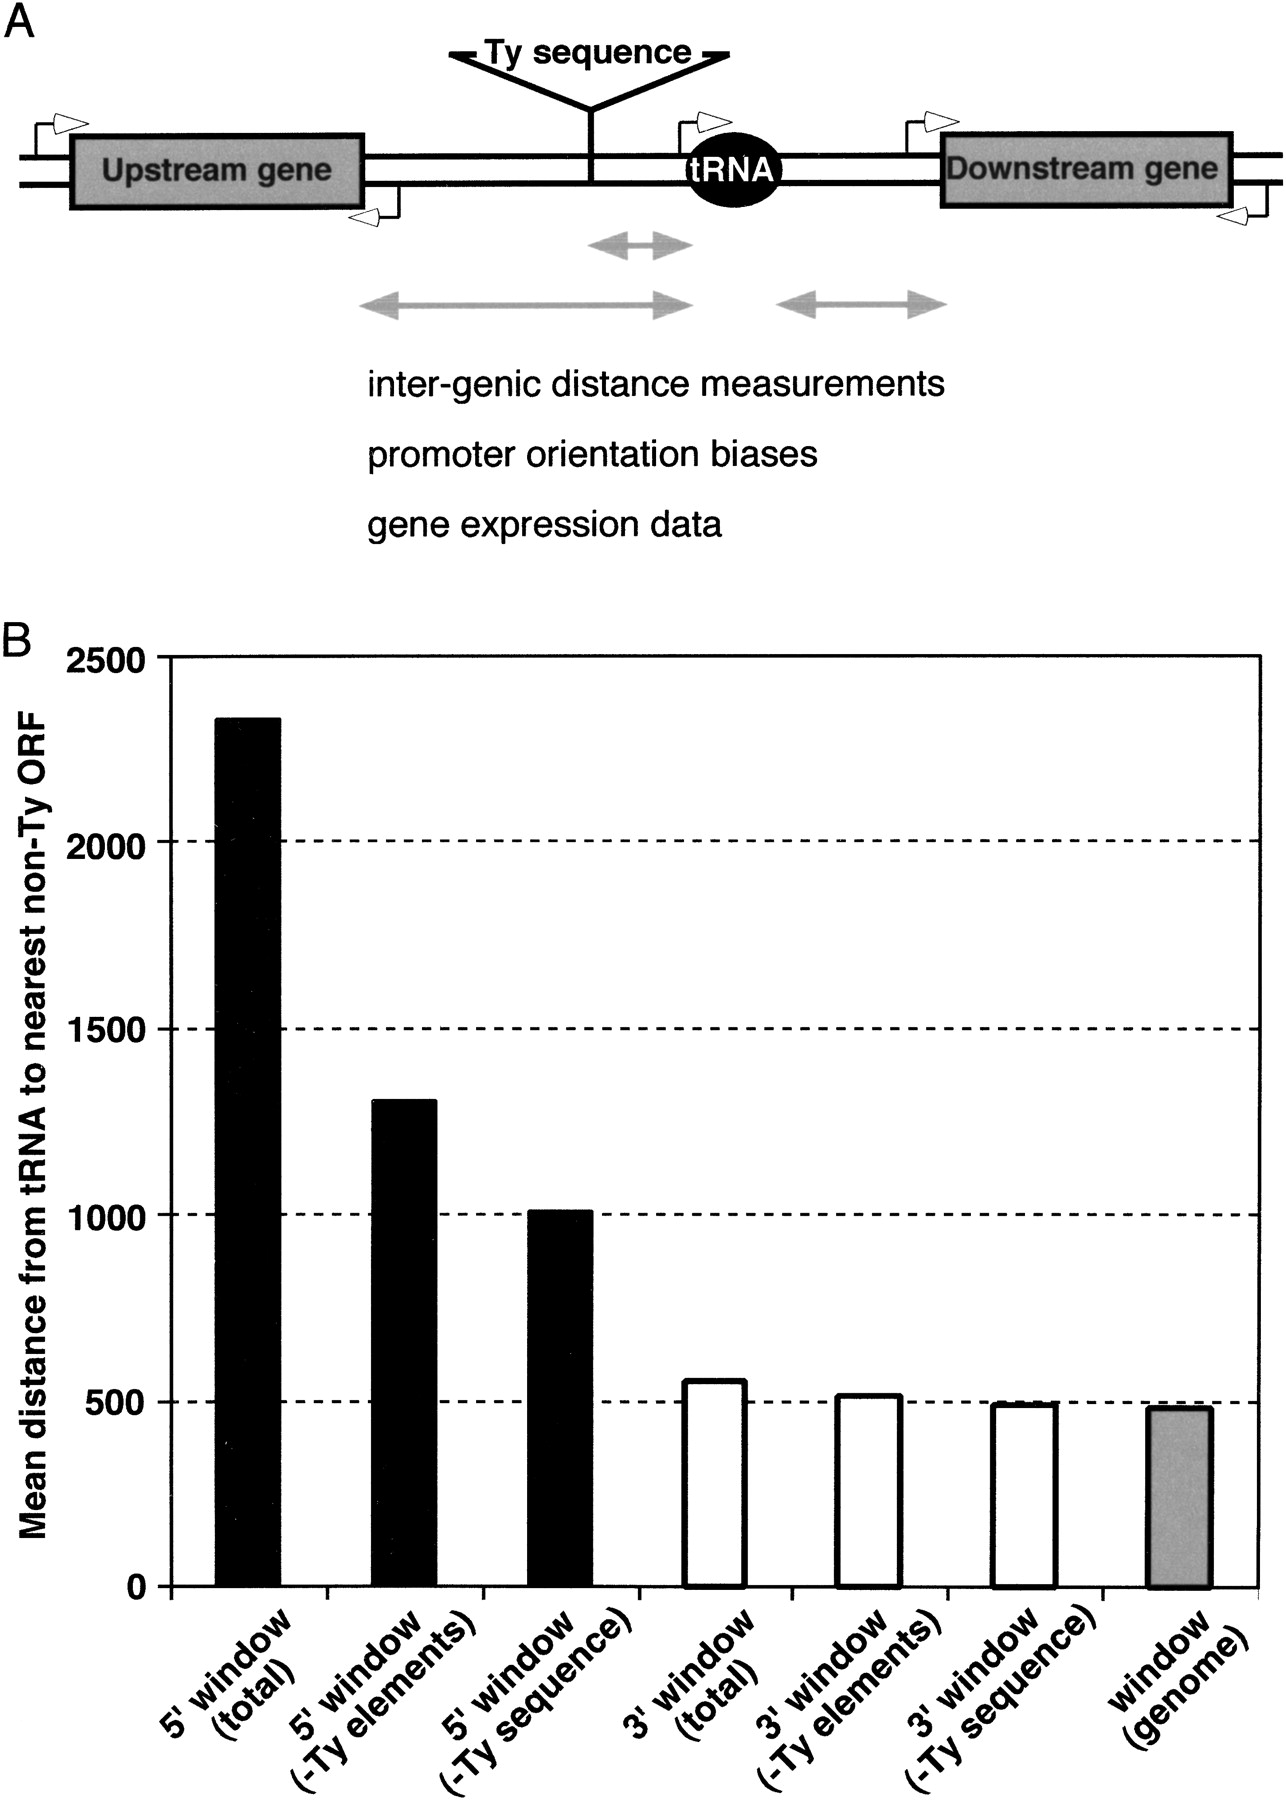
The tRNA gene loci database. (A) Graphic representation of the data included in the tRNA gene and Ty element database. Gene and Ty sequence nomenclature, coordinates and orientations are according to SGD. Gene expression data is according to the yeast Transcriptome database (Holstege et al. 1998). Intergenic distance measurements were based on the ORF coordinates assigned by SGD and not the start sites of transcription which remain to be determined for many genes. (B) The average intergenic window size upstream (5′, black bars) and downstream (3′, white bars) of all the tRNA genes in the genome (total). The average intergenic window size upstream (5′, black bars) and downstream (3′, white bars) of all the tRNA genes in the genome (total); if full-length Ty elements are excluded (-Ty elements); and if Ty element and LTR sequences are excluded (-Ty sequence) from the intergenic windows. The calculated mean genome-wide inter-ORF distance excluding telomeric regions (genome, gray) is indicated.


