
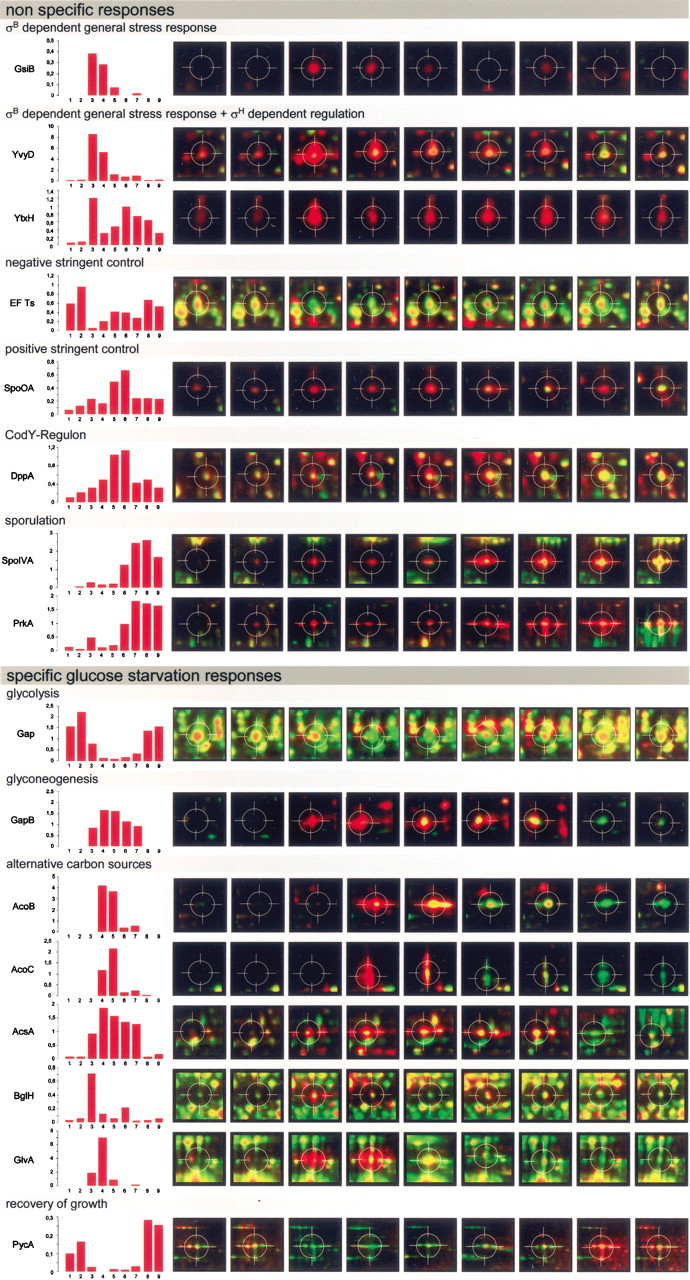
Figure 5.
Patterns of amount (green) and synthesis (red) of general stress/starvation and glucose starvation-specific proteins during different growth stages (columns correspond to the numbers in Fig. 1). Diagrams show protein synthesis in percentage normalized to the whole synthesis detectable on a 2D gel as described in Methods.


