
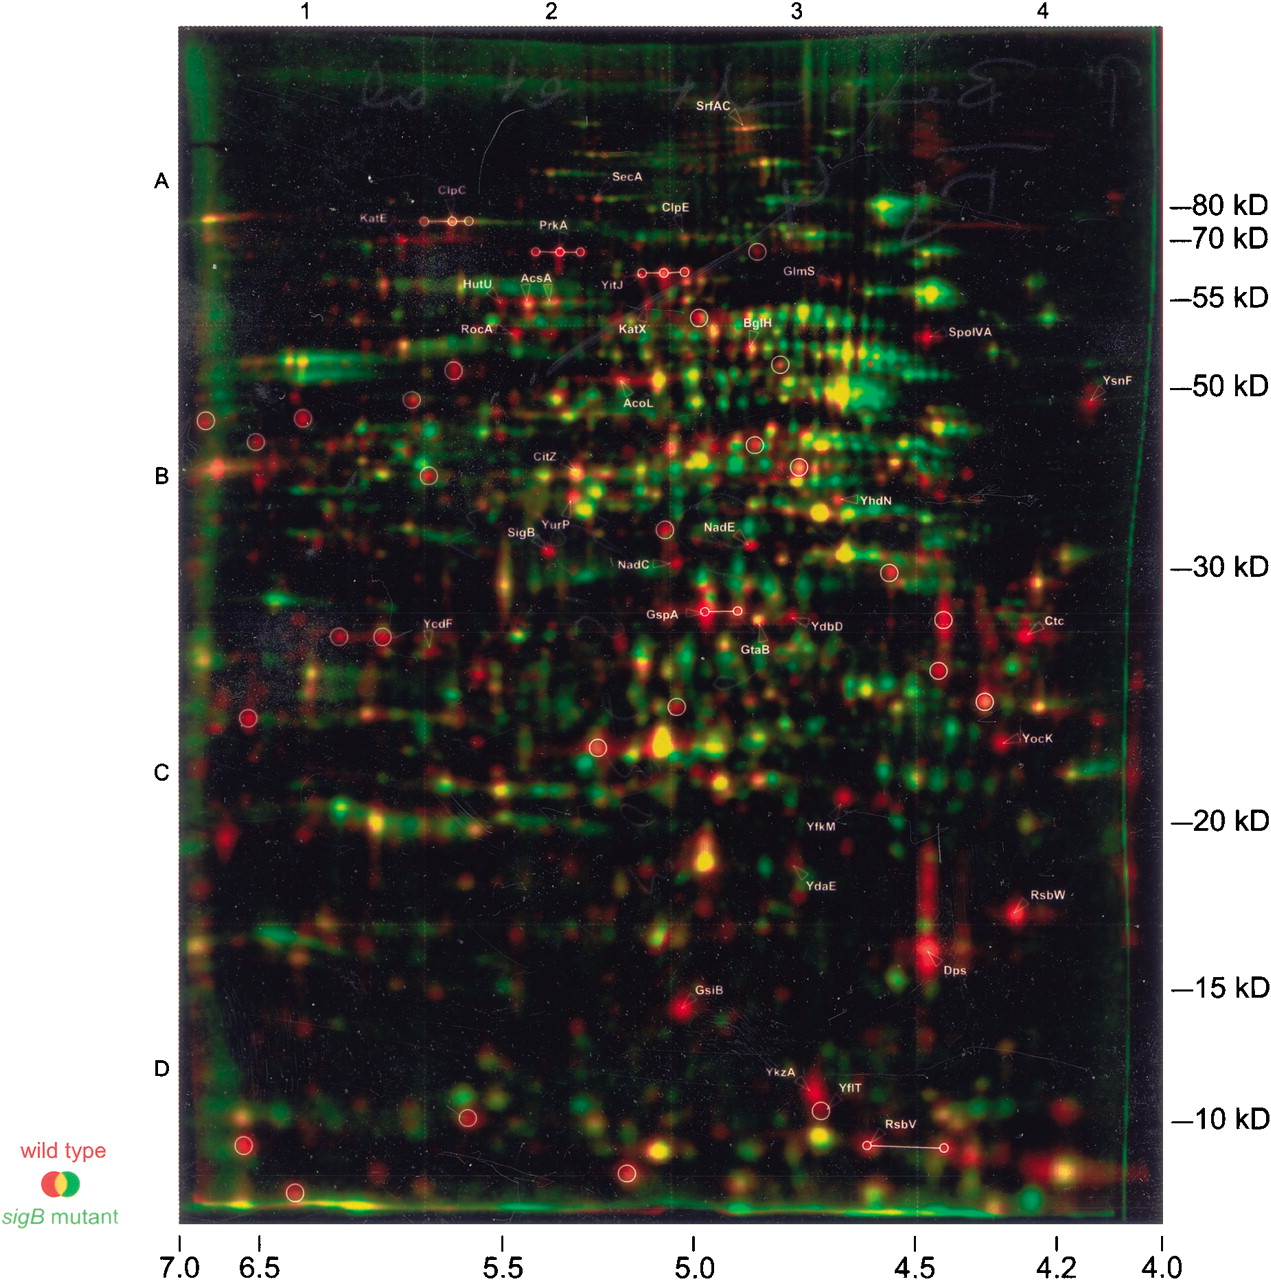
Figure 4.
Dual channel image of autoradiograms (protein synthesis) of B. subtilis 168 (red) and the isogenic sigB-mutant strain ML6 (green), transformed with the Delta2D two-dimensional gel analysis software. Samples were taken from cultures in the transient growth phase. Already identified spots synthesized at a higher rate in the wild type are indicated by text labels, and nonidentified spots by white circles. For spots induced in a ςB-dependent manner, see also Table 1.


