
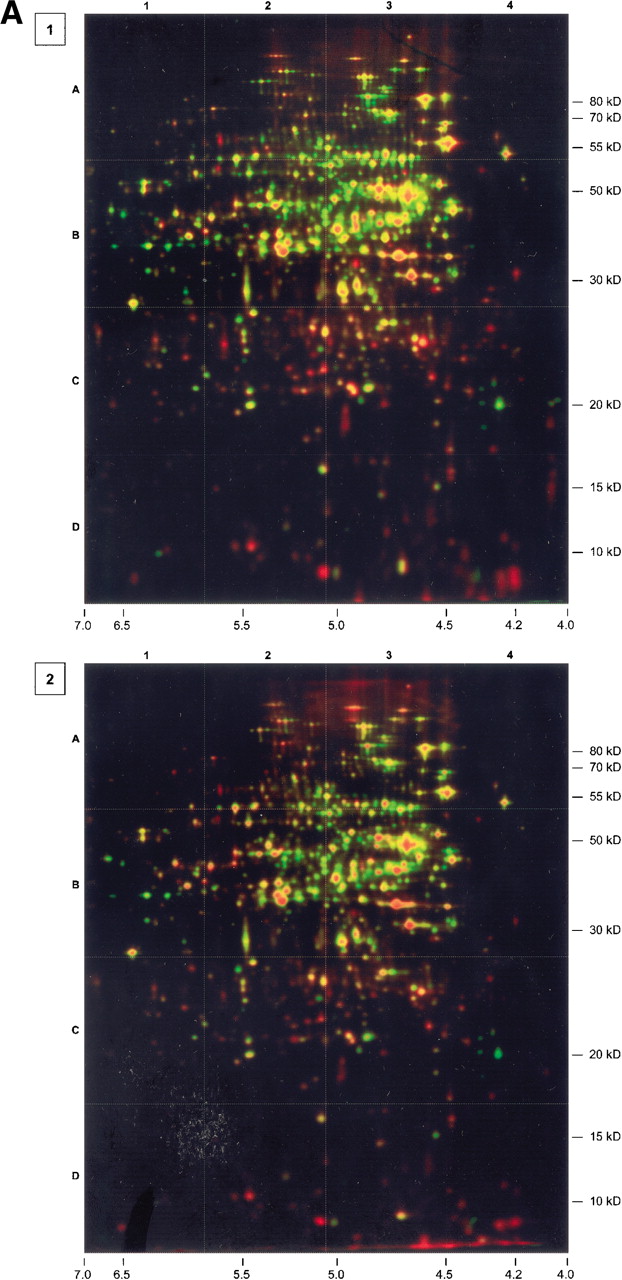
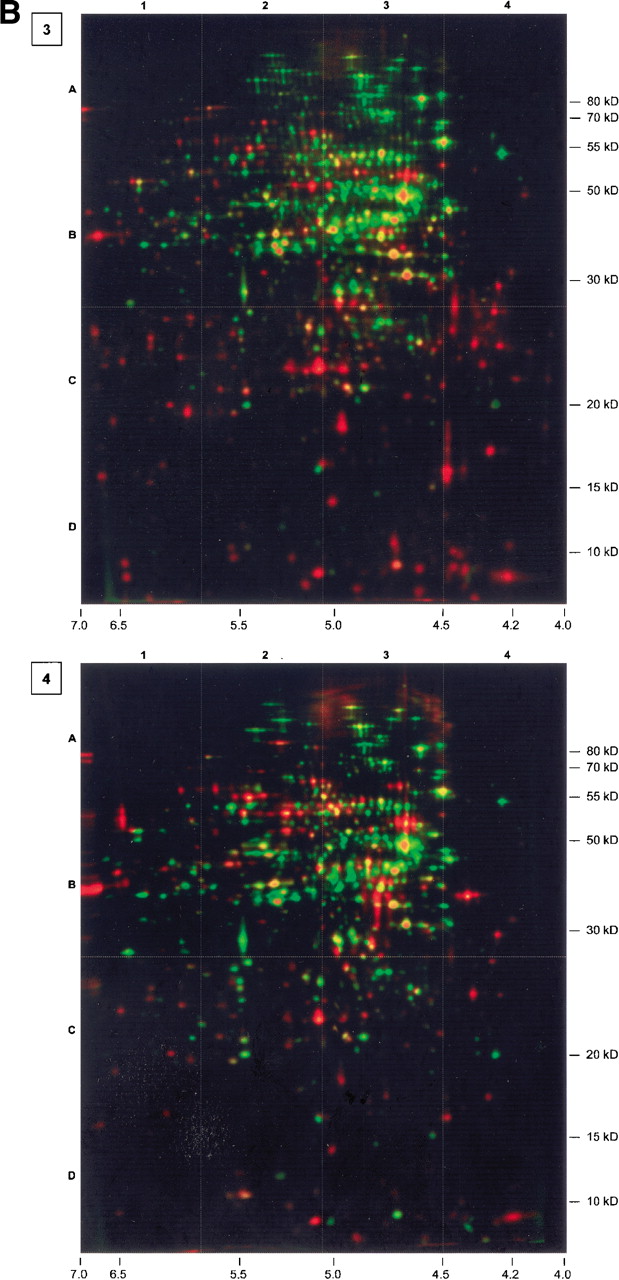
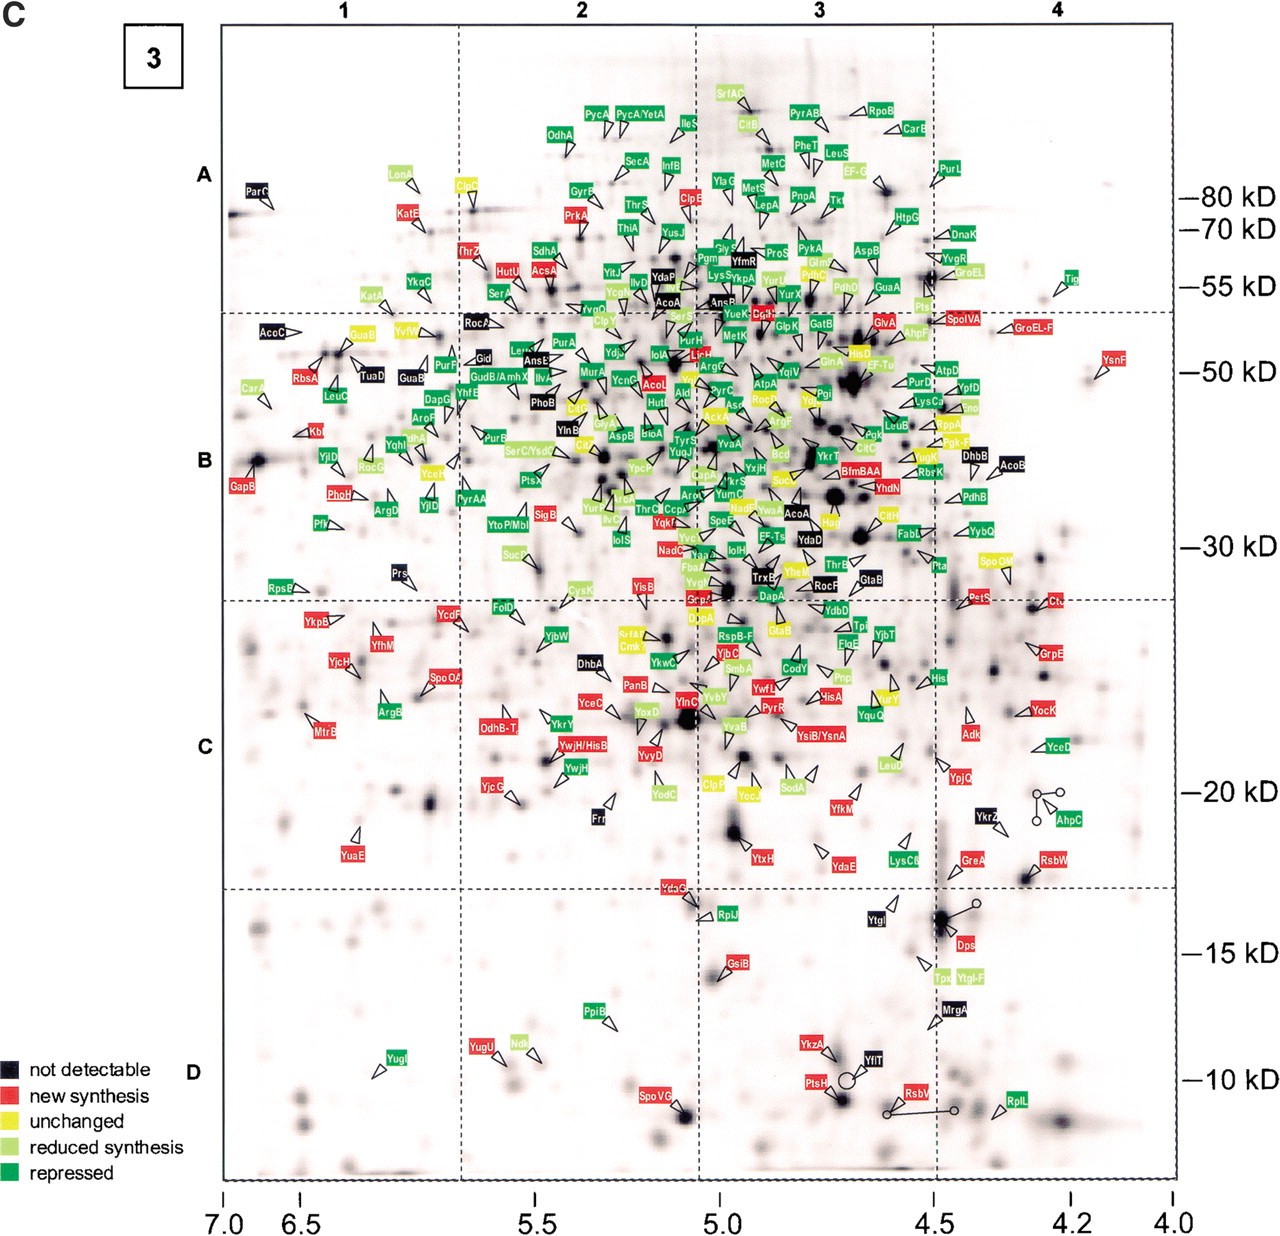
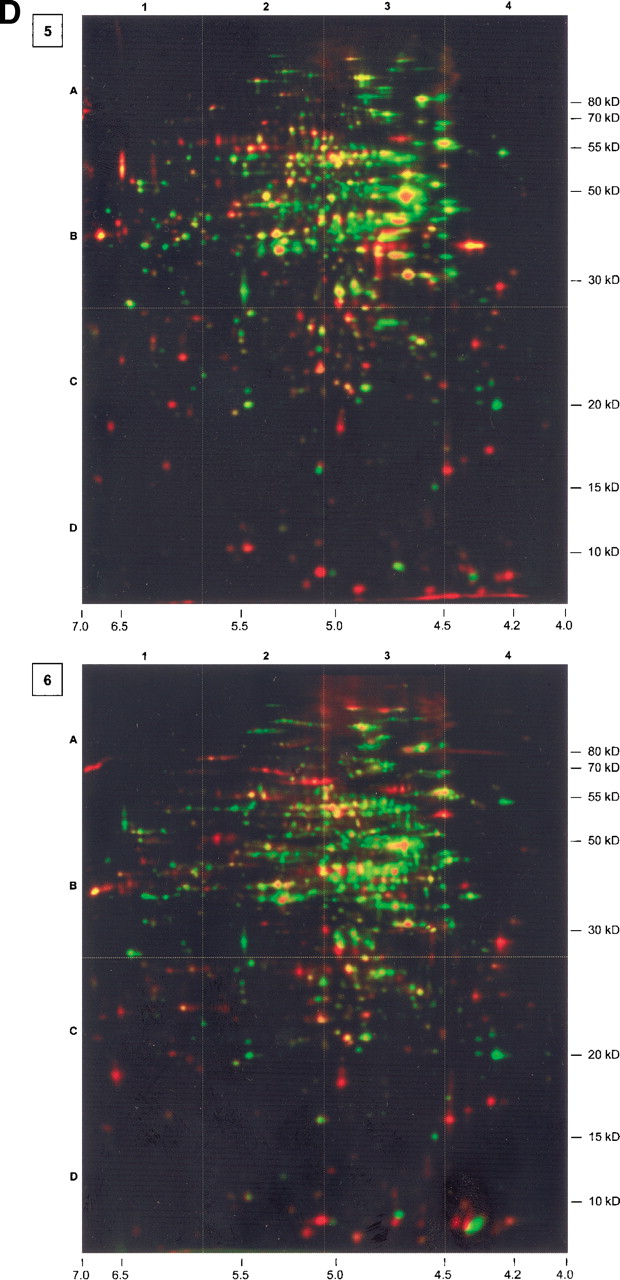
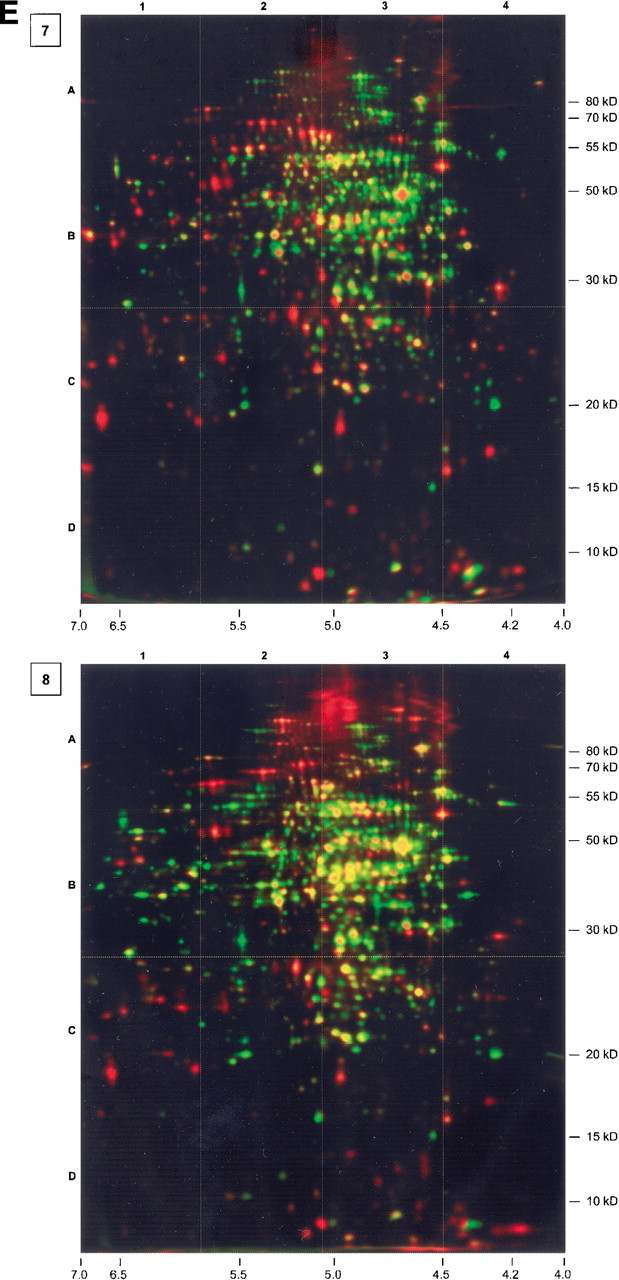
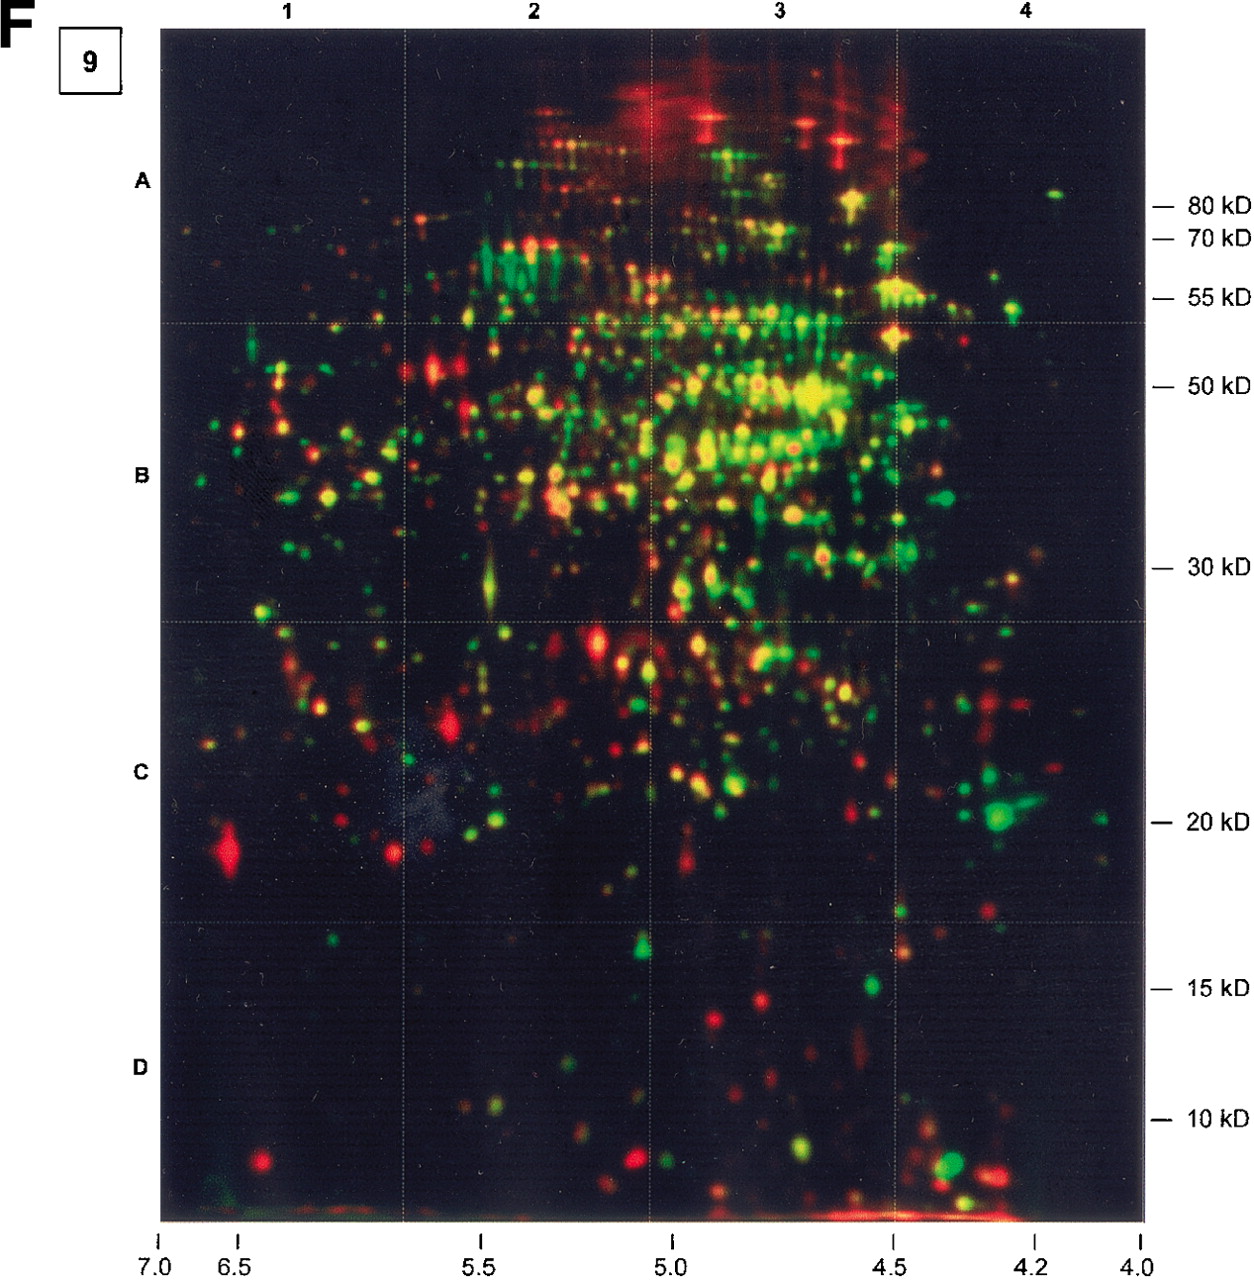
Figure 2.
Series of dual channel images (silver-stained protein amount, green; autoradiogram of currently synthesized protein, red). Numbers in boxes associate the images to the corresponding growth phase. For further information, see Figure 1. Gel 3 was complemented by a separate autoradiogram showing protein spots that had already been identified. The colors of the text boxes indicate the relative synthesis compared with exponential growth conditions (black, not detected; red, induced; yellow, unchanged; light green, slightly repressed; green, repressed).


